USD/JPY: Down 0.17% to 158.33 — Ascending Channel
MarketsFN Team
USD/JPY: Down 0.17% to 158.33 — Ascending Channel
Published: October 13, 2026 · MarketsFN Team · US Session
| Pair | Rate | Change | RSI(14) | SMA-20 | SMA-50 | 52W High | 52W Low | Pivot | R1 | S1 |
|---|---|---|---|---|---|---|---|---|---|---|
| USD/JPY | 158.33 | -0.17% | 50.9 | 157.66 | 157.72 | 163.84 | 152.09 | 158.47 | 158.88 | 158.20 |
📊 Support & Resistance Levels
Dynamic Trendlines
| Level | Type | Direction | Distance |
|---|---|---|---|
| 157.78 | 20d Support | ↗ ascending | -0.35% / 55.5 pips |
| 158.79 | 20d Resistance | → flat | +0.29% / 45.4 pips |
| 152.31 | 50d Support | → flat | -3.80% / 602.1 pips |
| 158.69 | 50d Resistance | ↘ descending | +0.22% / 35.6 pips |
Static Levels
| Level | Type | Touches | Distance |
|---|---|---|---|
| 159.85 | Resistance | 2× | +0.92% / 146.2 pips |
| 146.58 | Support | 2× | -7.46% / 1180.9 pips |
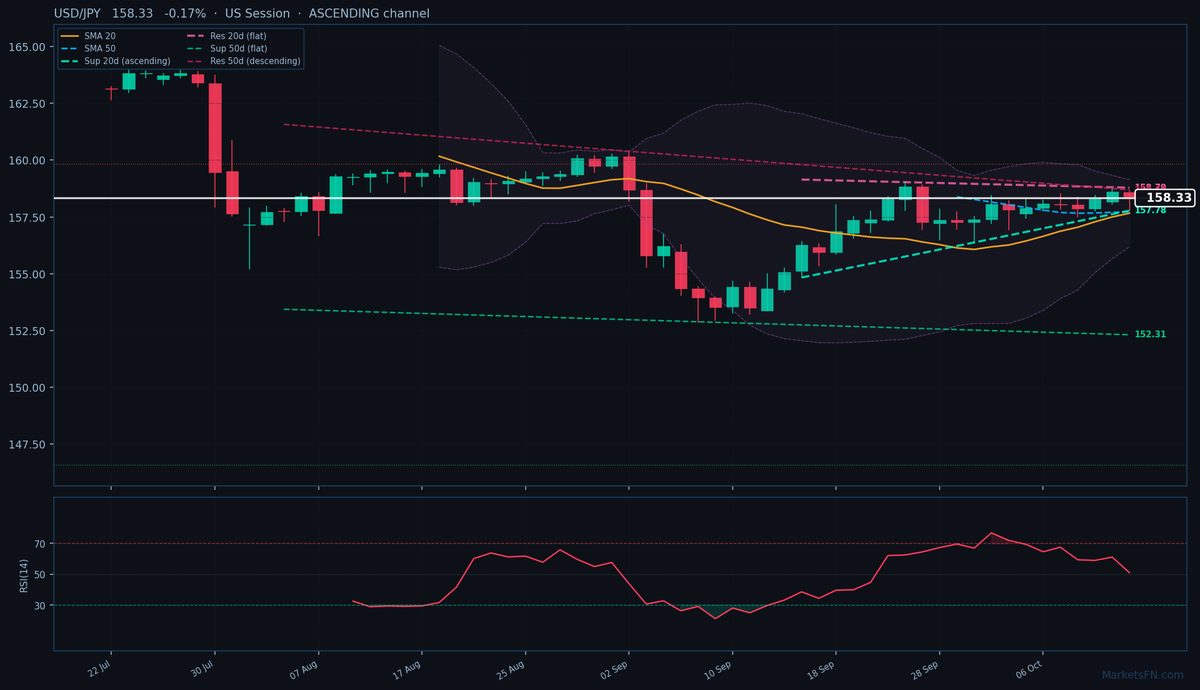
USD/JPY is trading at 158.33 (-0.17%), consolidating near the upper bound of its 20-day ascending channel after failing to breach the 158.64 intraday high. The pair remains firmly in an uptrend, trading above both the 20-day (157.66) and 50-day (157.72) SMAs, with the 20-day dynamic support trendline ascending at 157.78 (-55.5 pips). Immediate resistance sits at the flat 20-day dynamic trendline (158.79, +45.4 pips), while the 50-day descending resistance looms just above at 158.69 (+35.6 pips). The lack of meaningful static support nearby (nearest S1 at 146.58, -1180.9 pips) exposes the pair to downside volatility if the 20-day dynamic support breaks, though the closest static resistance (R1: 159.85, +146.2 pips) remains distant.
RSI at 50.9 shows neutral momentum, reflecting the pair’s indecision after last week’s rally. With the 20-day channel ascending but the 50-day descending, the conflict between short-term bullishness and medium-term bearish pressure suggests range-bound trading is likely near-term. A decisive break above the 20-day dynamic resistance (158.79) could target 159.00, while failure to hold 157.78 risks a test of the 50-day SMA (157.72). The US session’s price action will be key — a close above 158.47 (pivot) would reinforce bullish control, while a drop below 158.20 (S1) may trigger profit-taking toward 157.82 (today’s low). Watch for US CPI data tomorrow as the next catalyst for directional conviction.
Disclaimer
The content on MarketsFN.com is provided for educational and informational purposes only and does not constitute financial advice. All investments involve risk and past performance does not guarantee future results.