USD/CHF: Down 0.19% to 0.8329 — Ascending Channel
MarketsFN Team
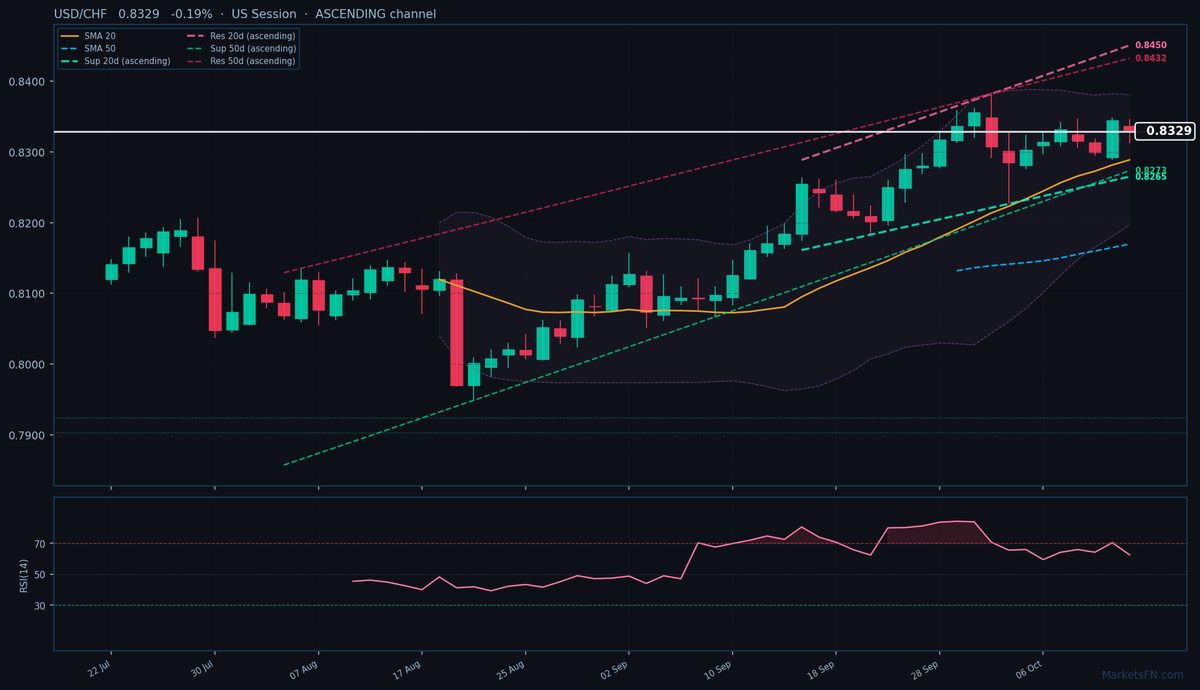
USD/CHF: Down 0.19% to 0.8329 — Ascending Channel
Published: October 13, 2026 · MarketsFN Team · US Session
| Pair | Rate | Change | RSI(14) | SMA-20 | SMA-50 | 52W High | 52W Low | Pivot | R1 | S1 |
|---|---|---|---|---|---|---|---|---|---|---|
| USD/CHF | 0.8329 | -0.19% | 62.6 | 0.8289 | 0.8170 | 0.8356 | 0.7609 | 0.8327 | 0.8366 | 0.8307 |
📊 Support & Resistance Levels
Dynamic Trendlines
| Level | Type | Direction | Distance |
|---|---|---|---|
| 0.8265 | 20d Support | ↗ ascending | -0.77% / 64.0 pips |
| 0.8450 | 20d Resistance | ↗ ascending | +1.46% / 121.4 pips |
| 0.8273 | 50d Support | ↗ ascending | -0.67% / 55.6 pips |
| 0.8432 | 50d Resistance | ↗ ascending | +1.24% / 103.0 pips |
Static Levels
| Level | Type | Touches | Distance |
|---|---|---|---|
| 0.7924 | Support | 2× | -4.87% / 405.8 pips |
| 0.7904 | Support | 2× | -5.12% / 426.3 pips |
USD/CHF is trading at 0.8329 (-0.19%), holding firmly above both its 20-day (0.8289) and 50-day (0.8170) SMAs, confirming the pair’s entrenched uptrend. The rate remains just 2 pips above today’s pivot at 0.8327, with immediate static resistance at R1 (0.8366, +37 pips) and support at S1 (0.8307, -22 pips). The 20-day dynamic channel is ascending, with current price sitting 64 pips above the dynamic support trendline (0.8265) and 121 pips below dynamic resistance (0.8450). The broader 50-day channel mirrors this structure, with dynamic support at 0.8273 (-56 pips) and resistance at 0.8432 (+103 pips).
RSI at 62.6 shows neutral momentum, neither overbought nor oversold, leaving room for further upside within the established trend. The pair’s proximity to the 52-week high (0.8356, +27 pips) suggests a potential test of this level if bullish momentum resumes, especially given the ascending channel structure. However, today’s dip below the previous close (0.8345) and failure to breach the day’s high (0.8346) indicates short-term hesitation.
The short-term outlook hinges on whether USD/CHF can reclaim 0.8345-0.8346 to target R1 and the yearly high. A break below S1 (0.8307) would expose the dynamic support trendlines near 0.8265-0.8273, though the ascending MAs should limit downside. Watch US session flows for confirmation—a close above 0.8346 would signal renewed bullish conviction toward 0.8366 resistance.
Disclaimer
The content on MarketsFN.com is provided for educational and informational purposes only and does not constitute financial advice. All investments involve risk and past performance does not guarantee future results.