USD/JPY: Down 0.11% to 160.25 — Ascending Channel
MarketsFN Team
USD/JPY: Down 0.11% to 160.25 — Ascending Channel
Published: June 17, 2026 · MarketsFN Team · US Session
| Pair | Rate | Change | RSI(14) | SMA-20 | SMA-50 | 52W High | 52W Low | Pivot | R1 | S1 |
|---|---|---|---|---|---|---|---|---|---|---|
| USD/JPY | 160.25 | -0.11% | 67.0 | 159.82 | 159.01 | 160.54 | 143.37 | 160.32 | 160.59 | 160.15 |
📊 Support & Resistance Levels
Dynamic Trendlines
| Level | Type | Direction | Distance |
|---|---|---|---|
| 159.77 | 20d Support | ↗ ascending | -0.30% / 47.8 pips |
| 161.07 | 20d Resistance | ↗ ascending | +0.51% / 81.7 pips |
| 158.43 | 50d Support | ↗ ascending | -1.14% / 181.9 pips |
| 160.57 | 50d Resistance | → flat | +0.20% / 32.2 pips |
Static Levels
| Level | Type | Touches | Distance |
|---|---|---|---|
| 146.59 | Support | 3× | -8.53% / 1366.2 pips |
| 142.35 | Support | 2× | -11.17% / 1789.9 pips |
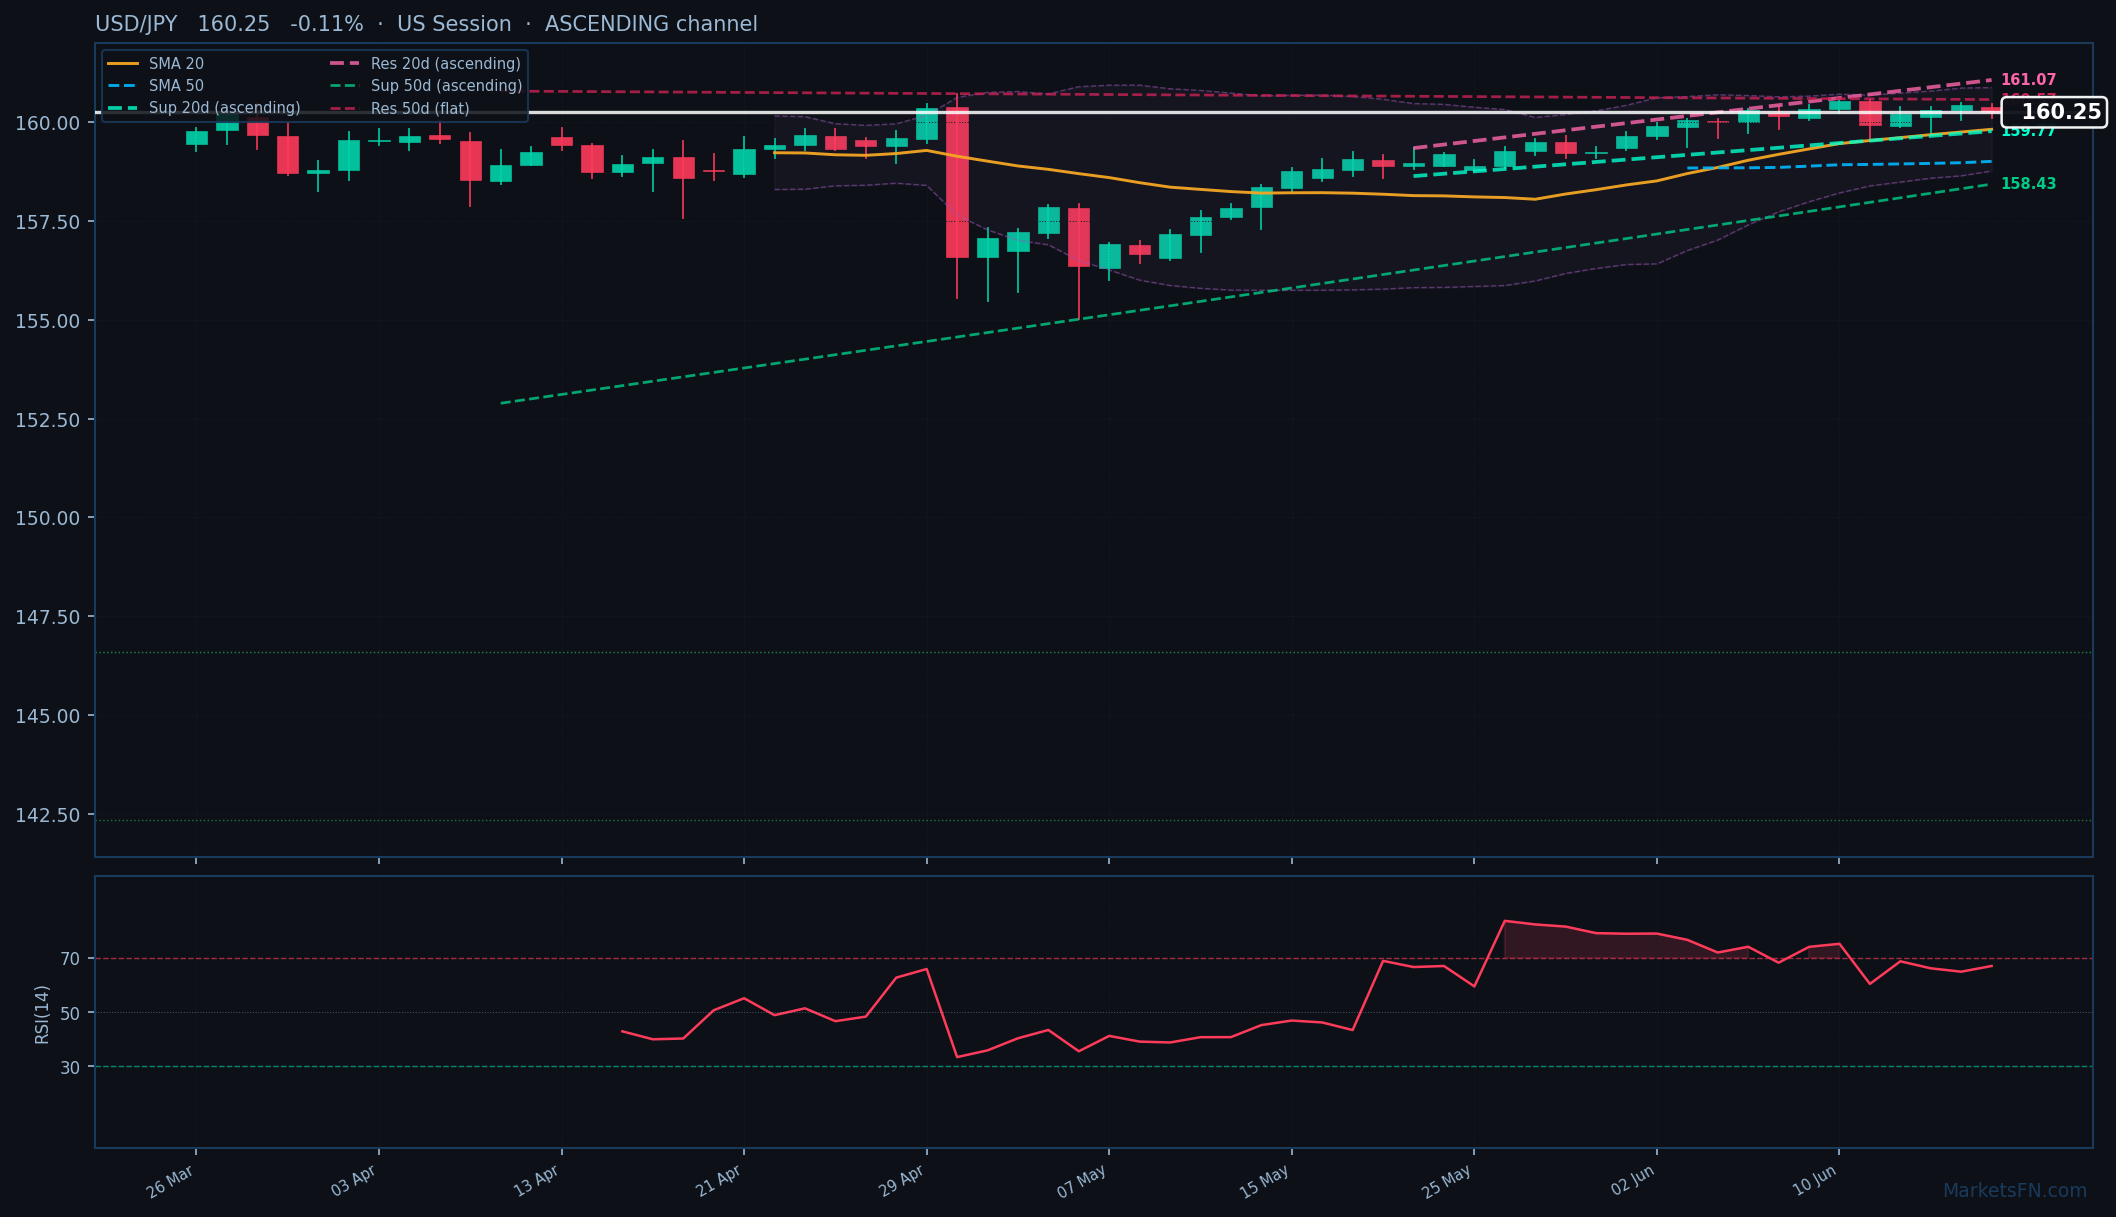
USD/JPY is trading at 160.25 (-0.11%), consolidating near its 52-week high of 160.54 as bullish momentum persists. The pair remains firmly above both the SMA-20 (159.82) and SMA-50 (159.01), confirming the uptrend’s structural integrity. Price action shows a tight daily range of just 34 pips (160.11–160.45), suggesting temporary equilibrium before the next directional move.
The 20-day dynamic channel is ascending, with immediate support at 159.77 (47.8 pips below current) and resistance at 161.07 (81.7 pips above). The 50-day channel also trends upward, with stronger support at 158.43 (181.9 pips below) and flatter resistance at 160.57 (32.2 pips above). This compression near the upper bound signals potential breakout vulnerability.
Static levels show S1 at 160.15 (10 pips below) and R1 at 160.59 (34 pips above), framing today’s pivot at 160.32. Notably, deeper historical supports at 146.59 and 142.35 remain distant (1366+ pips away), underscoring the pair’s extended rally. RSI at 67.0 flirts with overbought territory but hasn’t triggered divergence warnings yet.
Short-term bias leans bullish unless USD/JPY breaches 159.77 (20-day dynamic support). A close above 160.57 (50-day resistance) could accelerate toward the 52-week high. Watch for BoJ intervention whispers or US Treasury yield shifts as catalysts — the pair’s sensitivity to rate differentials remains acute. Current ATR(14) of 0.52 suggests subdued volatility, but positioning near multi-decade highs warrants caution.
Disclaimer
The content on MarketsFN.com is provided for educational and informational purposes only and does not constitute financial advice. All investments involve risk and past performance does not guarantee future results.


