USD/JPY: Down 0.06% to 154.25 — RSI Oversold
MarketsFN Team
USD/JPY: Down 0.06% to 154.25 — RSI Oversold
Published: September 08, 2026 · MarketsFN Team · US Session
| Pair | Rate | Change | RSI(14) | SMA-20 | SMA-50 | 52W High | 52W Low | Pivot | R1 | S1 |
|---|---|---|---|---|---|---|---|---|---|---|
| USD/JPY | 154.25 | -0.06% | 29.1 | 158.46 | 160.17 | 163.84 | 147.03 | 154.88 | 155.72 | 153.50 |
📊 Support & Resistance Levels
Dynamic Trendlines
| Level | Type | Direction | Distance |
|---|---|---|---|
| 152.88 | 20d Support | ↘ descending | -0.88% / 136.4 pips |
| 160.57 | 20d Resistance | ↗ ascending | +4.10% / 632.3 pips |
| 152.83 | 50d Support | ↘ descending | -0.92% / 141.9 pips |
| 159.83 | 50d Resistance | ↘ descending | +3.62% / 558.6 pips |
Static Levels
| Level | Type | Touches | Distance |
|---|---|---|---|
| 159.85 | Resistance | 2× | +3.82% / 587.7 pips |
| 157.91 | Resistance | 2× | +2.56% / 393.9 pips |
| 146.59 | Support | 3× | -4.79% / 738.1 pips |
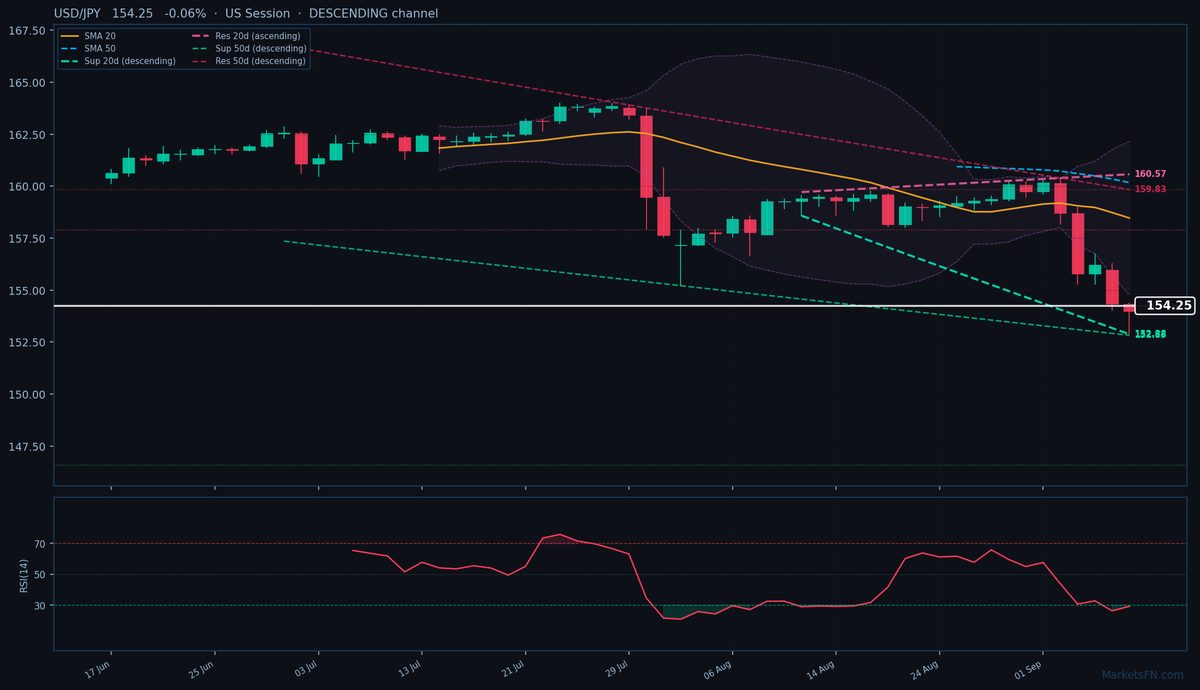
USD/JPY is trading at 154.25 (-0.06%), testing the lower bounds of a firmly entrenched downtrend as price action remains trapped below both the 20-day (158.46) and 50-day (160.17) SMAs. The pair is now 632.3 pips below the ascending 20-day dynamic resistance at 160.57, while the descending 50-day channel shows even more pronounced bearish momentum with resistance at 159.83 (558.6 pips away). Immediate dynamic support sits at 152.88 (136.4 pips below), which aligns with today’s session low and could trigger a technical bounce if tested again.
The RSI at 29.1 confirms oversold conditions, but with static resistance at 157.91 (393.9 pips above) acting as a formidable ceiling, any relief rally faces stiff overhead supply. Notably, the nearest static support (S1 at 153.50) is just 75 pips away and aligns with today’s pivot, making it a critical near-term battleground. A break below would expose the descending dynamic support at 152.83 (141.9 pips down), though the extreme oversold reading suggests short-covering potential.
The short-term outlook remains bearish below the SMAs, but traders should watch for divergence signals given the stretched momentum. Confirmation of a reversal would require a close above the 20-day SMA (158.46), while sustained pressure below 153.50 opens the path toward the 52-week low at 147.03. The US session’s ability to hold above today’s pivot (154.88) will determine whether this is consolidation or continuation.
Disclaimer
The content on MarketsFN.com is provided for educational and informational purposes only and does not constitute financial advice. All investments involve risk and past performance does not guarantee future results.