USD/JPY: Down 0.04% to 157.75 — RSI Signals Overbought
MarketsFN Team
USD/JPY: Down 0.04% to 157.75 — RSI Signals Overbought
Published: October 05, 2026 · MarketsFN Team
| Pair | Rate | Change | RSI(14) | SMA-20 | SMA-50 | 52W High | 52W Low | Pivot | R1 | S1 |
|---|---|---|---|---|---|---|---|---|---|---|
| USD/JPY | 157.75 | -0.04% | 75.4 | 156.25 | 158.04 | 163.86 | 153.42 | 157.71 | 158.43 | 157.20 |
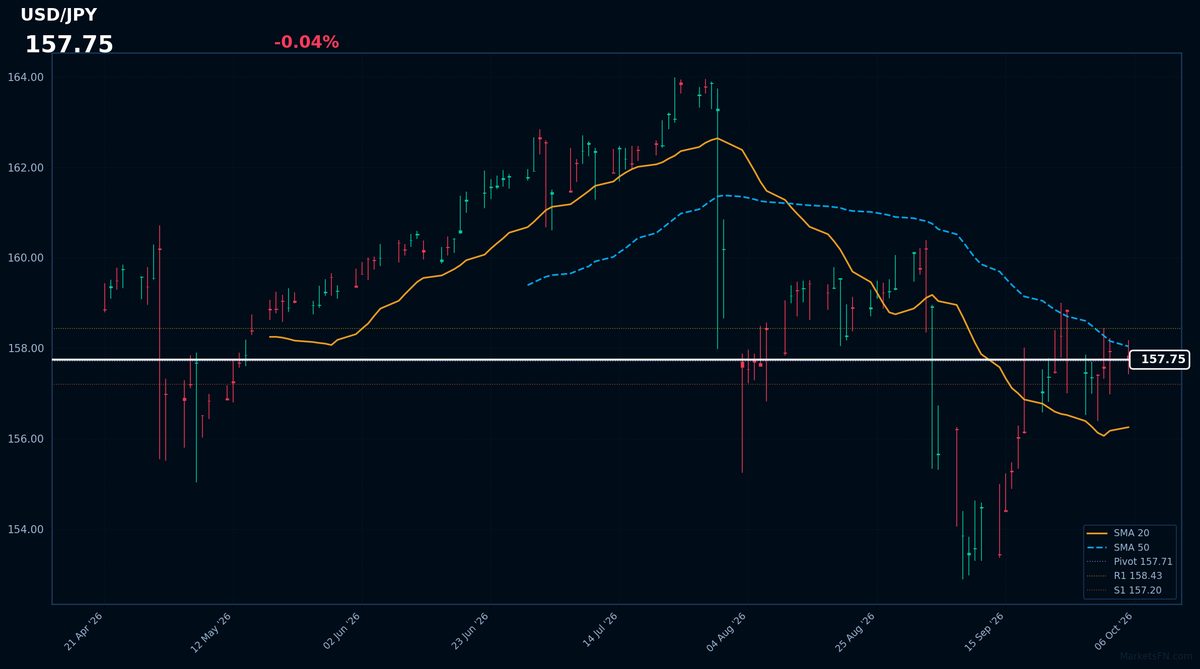
USD/JPY is trading at 157.75 (-0.04%), signaling a precarious stalemate as the pair struggles to reclaim the SMA-50 of 158.04. The market is currently trapped in a consolidation phase, caught between the bullish support of the SMA-20 at 156.25 and the overhead resistance of the SMA-50. This lack of direction is compounded by an RSI(14) of 75.4, which places the pair firmly in overbought territory and suggests that the upside is heavily capped. With an ATR(14) of 1.28, daily volatility remains tight, reflecting a hesitant market that is underpricing the risk of a sharp correction from these elevated levels.
The immediate technical battleground centers on the pivot of 157.71. A failure to hold this level opens the door to S1 at 157.20, while a break above the pivot targets R1 at 158.43. Given that the current rate is below the SMA-50 but above the SMA-20, the trend is neutral-to-bearish in the short term. The market is ignoring the overbought RSI signal, but the proximity to the 52-week high of 163.86 suggests limited room for error. The primary catalyst to invalidate this neutral view will be a decisive daily close above the R1 level of 158.43, which would signal a resumption of the bullish trend.
Disclaimer
The content on MarketsFN.com is provided for educational and informational purposes only. It does not constitute financial advice or investment recommendations. All investments involve risks and past performance does not guarantee future results. You are solely responsible for your investment decisions.