USD/HUF: Up 1.73% to 318.09 — Ascending Channel
MarketsFN Team
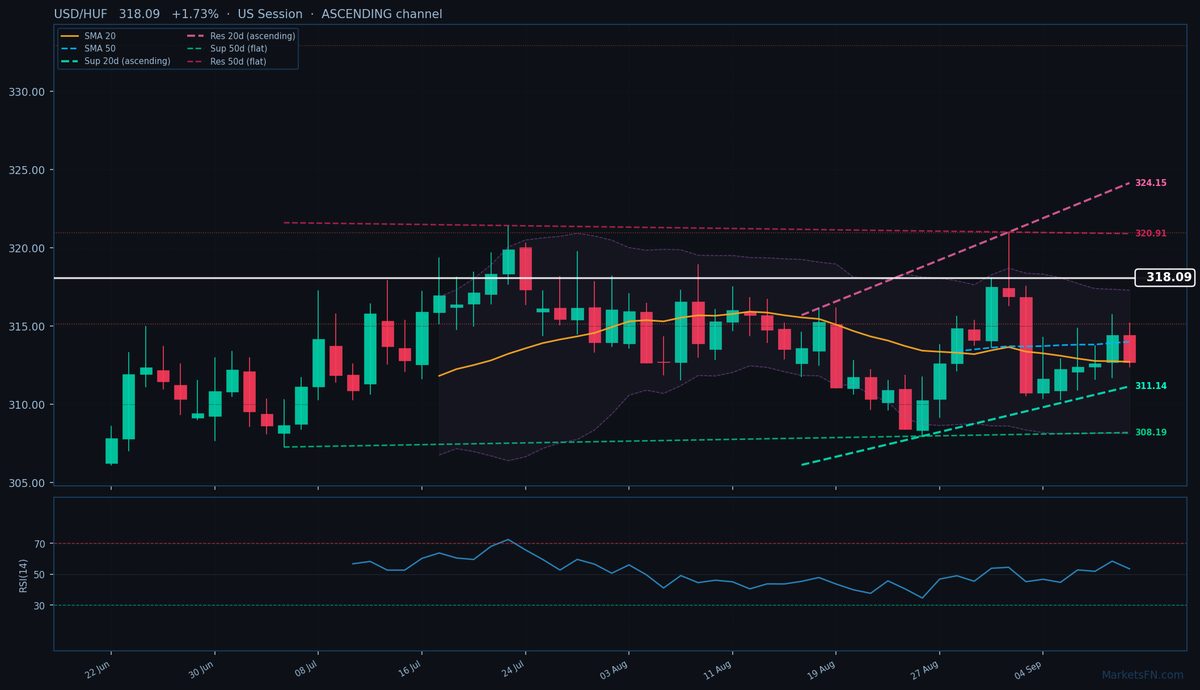
USD/HUF: Up 1.73% to 318.09 — Ascending Channel
Published: September 14, 2026 · MarketsFN Team · US Session · Emerging FX
| Pair | Rate | Change | RSI(14) | SMA-20 | SMA-50 | 52W High | 52W Low | Pivot | R1 | S1 |
|---|---|---|---|---|---|---|---|---|---|---|
| USD/HUF | 318.09 | +1.73% | 53.5 | 312.71 | 313.99 | 343.74 | 300.33 | 313.95 | 316.22 | 312.17 |
S/R Support & Resistance Levels
Dynamic Trendlines
| Level | Type | Direction | Distance |
|---|---|---|---|
| 311.14 | 20d Support | up (ascending) | -2.19% / 695.0 pips |
| 324.15 | 20d Resistance | up (ascending) | +1.90% / 605.9 pips |
| 308.19 | 50d Support | flat (flat) | -3.11% / 990.2 pips |
| 320.91 | 50d Resistance | flat (flat) | +0.89% / 281.9 pips |
Static Levels
| Level | Type | Touches | Distance |
|---|---|---|---|
| 332.94 | Resistance | 2x | +6.48% / 2027.2 pips |
| 320.96 | Resistance | 2x | +2.65% / 829.2 pips |
| 315.15 | Resistance | 2x | +0.79% / 247.4 pips |
USD/HUF is trading at 318.09 (+1.73%), breaking decisively above both the 20-day SMA (312.71) and 50-day SMA (313.99) in a bullish confirmation of the near-term uptrend. The pair has surged past the previous day's high of 315.19, testing the upper bounds of its 20-day ascending channel, which shows dynamic resistance at 324.15 (+3.67%, 605.9 pips away) and dynamic support at 311.14 (-0.49%, 695.0 pips below). The 50-day channel remains flat, suggesting longer-term consolidation between 308.19 and 320.91, but today's breakout above the 50-day resistance trendline (+2.63%, 281.9 pips away) signals potential for further upside.
Static levels show immediate resistance at R1 (316.22, 247.4 pips away) and support at S1 (312.17, 592.0 pips below), with the pair already clearing the European session's pivot at 313.95. RSI at 53.5 is neutral but leaning bullish as momentum builds, while the ATR(14) of 3.76 suggests volatility is expanding. The key short-term risk is a pullback to test the 20-day SMA (312.71), but the breach of the 50-day SMA and proximity to the 20-day dynamic resistance imply buyers are in control. A close above 316.22 (R1) would confirm the next leg higher toward 320.91 (50-day resistance). Watch for Budapest market reaction to today's move — a failure to hold above 315.15 (static R1) could trigger profit-taking.
Disclaimer
The content on MarketsFN.com is provided for educational and informational purposes only and does not constitute financial advice. All investments involve risk and past performance does not guarantee future results.