USD/HUF: Up 0.80% to 314.40 — Bullish — Above Key MAs
MarketsFN Team
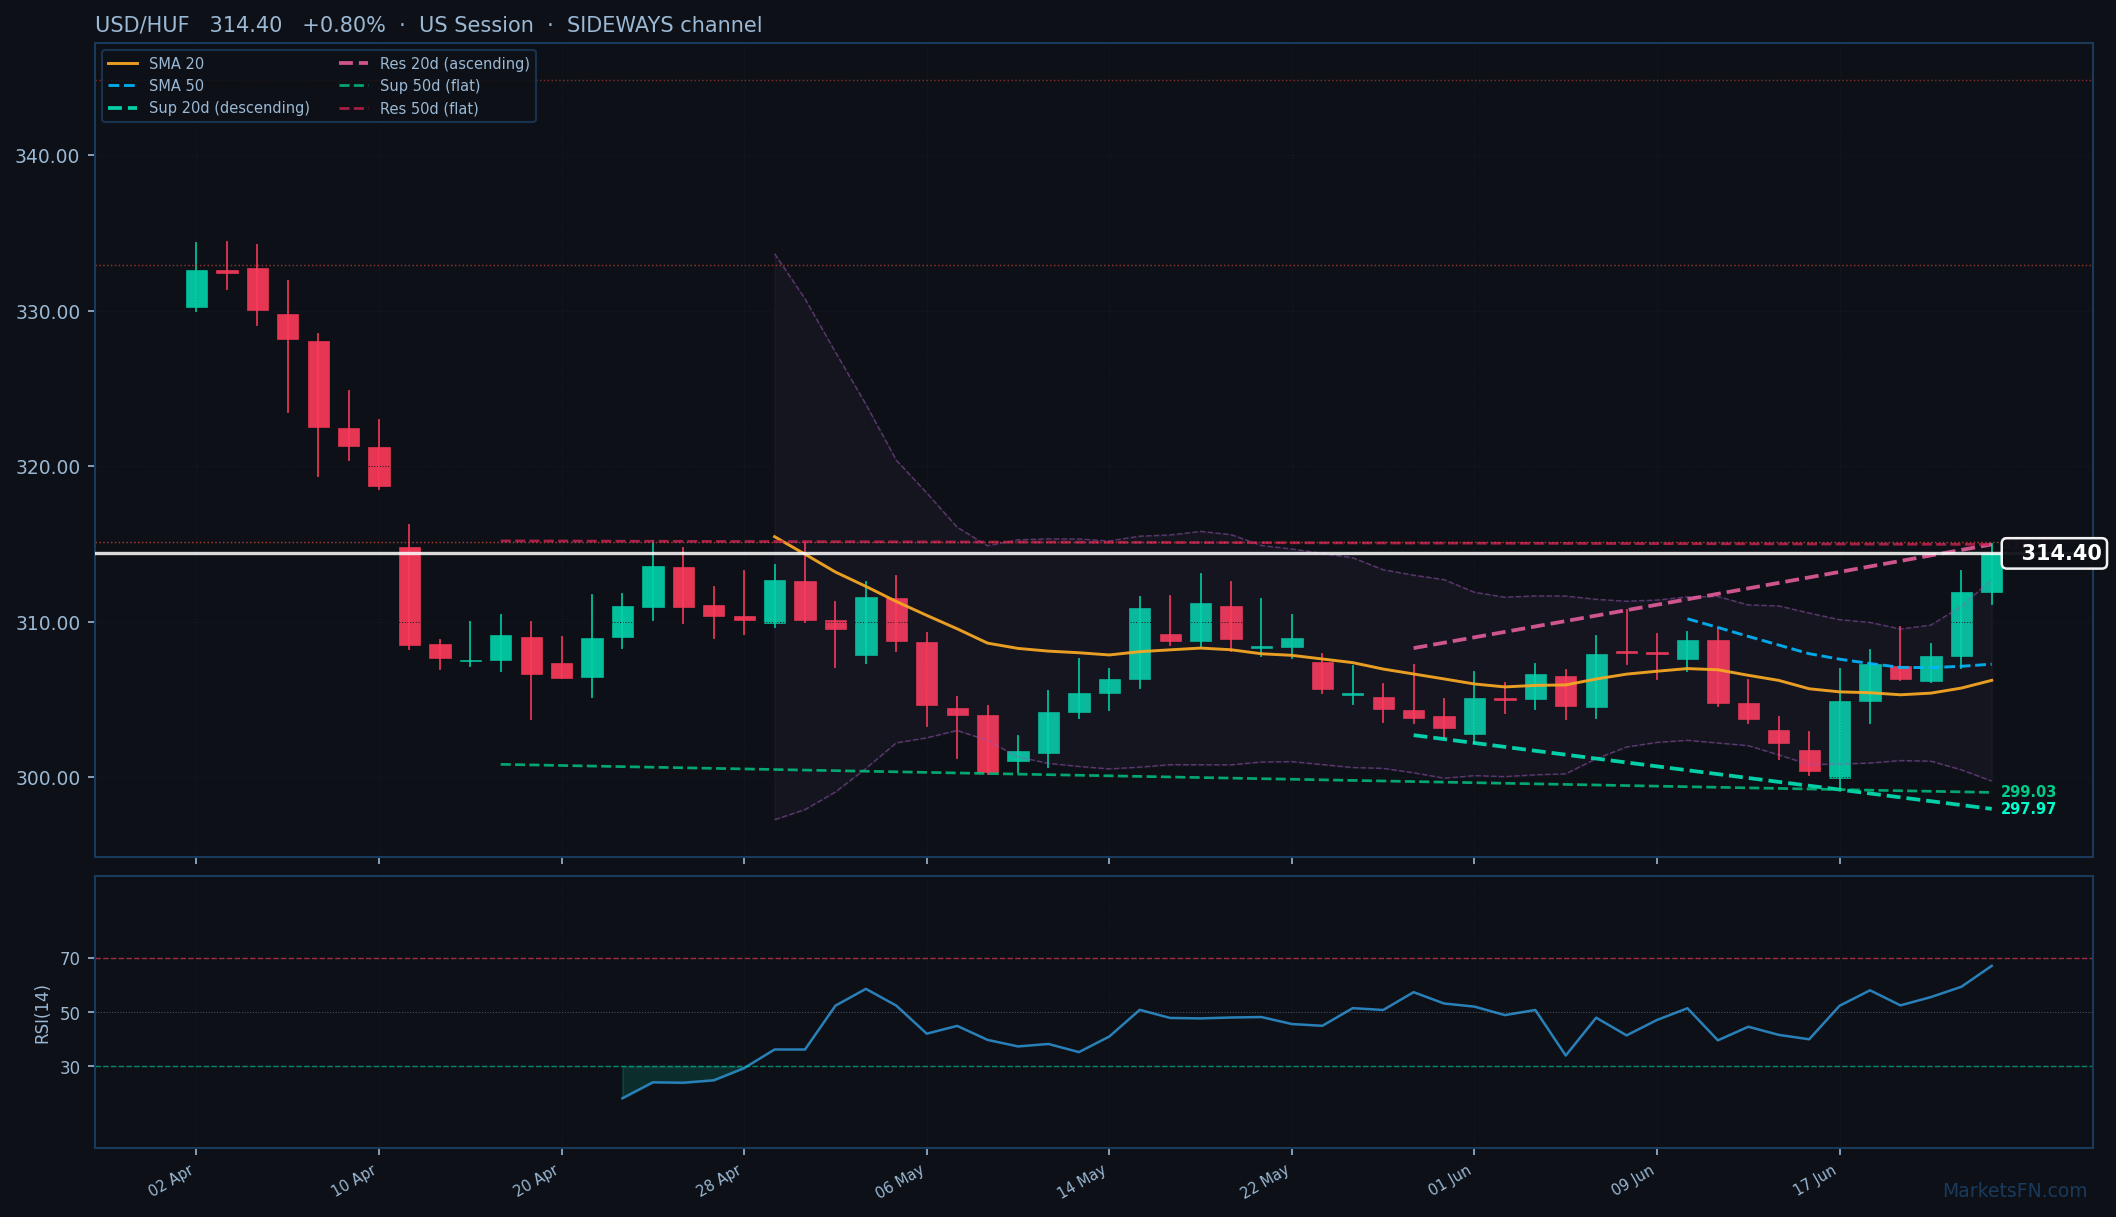
USD/HUF: Up 0.80% to 314.40 — Bullish — Above Key MAs
Published: June 24, 2026 · MarketsFN Team · US Session · Emerging FX
| Pair | Rate | Change | RSI(14) | SMA-20 | SMA-50 | 52W High | 52W Low | Pivot | R1 | S1 |
|---|---|---|---|---|---|---|---|---|---|---|
| USD/HUF | 314.40 | +0.80% | 67.0 | 306.23 | 307.27 | 350.77 | 300.33 | 310.74 | 314.45 | 308.20 |
S/R Support & Resistance Levels
Dynamic Trendlines
| Level | Type | Direction | Distance |
|---|---|---|---|
| 297.97 | 20d Support | down (descending) | -5.23% / 1643.1 pips |
| 314.97 | 20d Resistance | up (ascending) | +0.18% / 57.7 pips |
| 299.03 | 50d Support | flat (flat) | -4.89% / 1537.2 pips |
| 314.97 | 50d Resistance | flat (flat) | +0.18% / 57.7 pips |
Static Levels
| Level | Type | Touches | Distance |
|---|---|---|---|
| 344.84 | Resistance | 2x | +9.68% / 3044.8 pips |
| 332.94 | Resistance | 2x | +5.90% / 1855.3 pips |
| 315.15 | Resistance | 2x | +0.24% / 75.5 pips |
USD/HUF is trading at 314.40 (+0.80%), testing the upper bounds of its short-term dynamic resistance trendline at 314.97 (just 57.7 pips above). The pair shows bullish momentum, trading above both the SMA-20 (306.23) and SMA-50 (307.27), confirming an uptrend. However, the 20-day and 50-day channels are technically sideways (avg slope), suggesting consolidation near current levels rather than a strong directional breakout.
The dynamic support trendlines sit far below at 297.97 (20-day, descending) and 299.03 (50-day, flat), both over 1,500 pips away, indicating no immediate downside pressure. Static support S1 at 308.20 is 620 pips below, while R1 at 315.15 looms just 75.5 pips above — a critical test for bullish continuation. A break above R1 could target R2 at 332.94 (1,855 pips away), but the RSI at 67.0 warns of nearing overbought conditions without yet signaling exhaustion.
Short-term, the pair is range-bound between S1 (308.20) and R1 (315.15), with upside bias given the MA positioning. Watch for a confirmed break above 315.15 to validate further gains, while failure here may see a pullback toward SMA-20 support. The ATR(14) of 3.99 suggests subdued volatility, favoring tactical trades over trend-following. The next catalyst is the European session’s reaction to R1 — a close above it would shift the outlook decisively bullish.
Disclaimer
The content on MarketsFN.com is provided for educational and informational purposes only and does not constitute financial advice. All investments involve risk and past performance does not guarantee future results.


