USD/HUF: Up 0.37% to 326.69 — RSI Overbought
MarketsFN Team
USD/HUF: Up 0.37% to 326.69 — RSI Overbought
Published: October 09, 2026 · MarketsFN Team · US Session · Emerging FX
| Pair | Rate | Change | RSI(14) | SMA-20 | SMA-50 | 52W High | 52W Low | Pivot | R1 | S1 |
|---|---|---|---|---|---|---|---|---|---|---|
| USD/HUF | 326.69 | +0.37% | 71.6 | 320.75 | 316.39 | 343.74 | 300.33 | 326.07 | 329.11 | 323.27 |
S/R Support & Resistance Levels
Dynamic Trendlines
| Level | Type | Direction | Distance |
|---|---|---|---|
| 323.86 | 20d Support | up (ascending) | -0.87% / 283.7 pips |
| 333.25 | 20d Resistance | up (ascending) | +2.01% / 656.0 pips |
| 317.02 | 50d Support | up (ascending) | -2.96% / 966.9 pips |
| 331.11 | 50d Resistance | up (ascending) | +1.35% / 442.2 pips |
Static Levels
| Level | Type | Touches | Distance |
|---|---|---|---|
| 344.84 | Resistance | 2x | +5.65% / 1845.4 pips |
| 332.94 | Resistance | 2x | +2.01% / 655.9 pips |
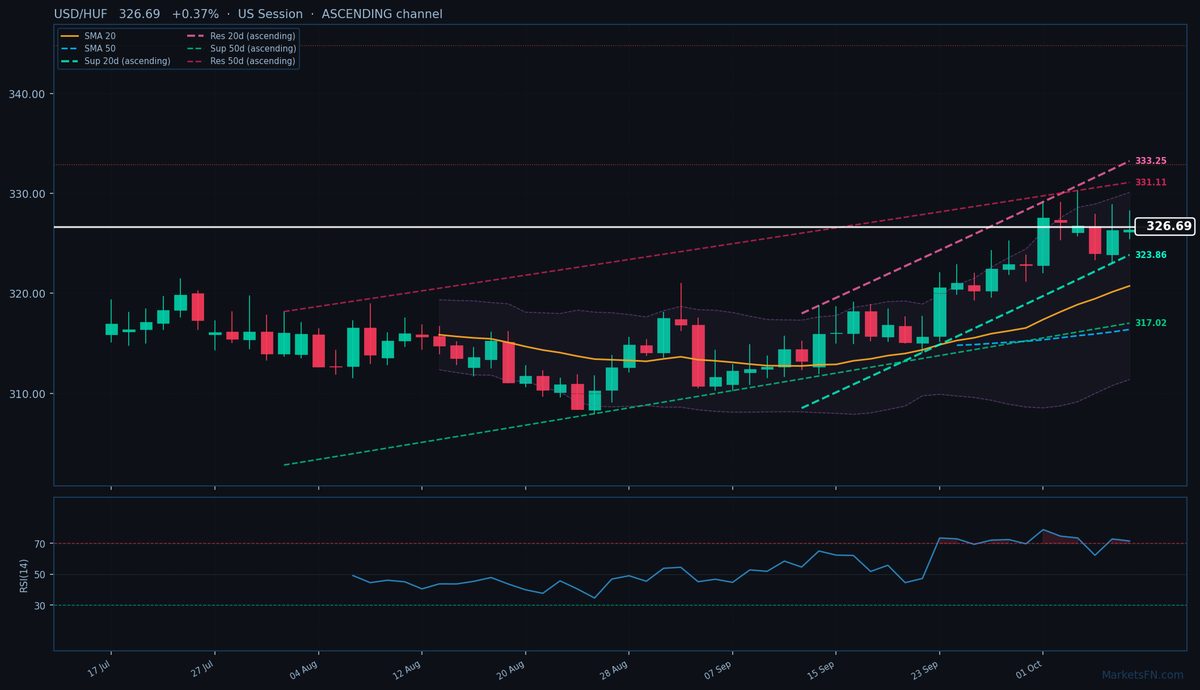
USD/HUF is trading at 326.69 (+0.37%), extending its uptrend as the pair remains firmly above both the 20-day (320.75) and 50-day (316.39) SMAs, confirming bullish momentum. The current price sits 283.7 pips above the 20-day dynamic support trendline (323.86) and 656.0 pips below the 20-day dynamic resistance (333.25), with both trendlines forming an ascending channel. The 50-day channel also slopes upward, with support at 317.02 (-966.9 pips) and resistance at 331.11 (+442.2 pips), reinforcing the broader bullish structure.
Static levels highlight immediate resistance at R1 (329.11, +242.2 pips) and support at S1 (323.27, -342.2 pips), though the dynamic trendlines currently dominate price action. The RSI(14) at 71.6 signals overbought conditions, suggesting potential near-term consolidation or pullback, though the strong trend may delay a reversal. With the ATR(14) at 4.14, volatility remains elevated, keeping the upside open for a test of the 20-day dynamic resistance (333.25).
Short-term, the pair’s trajectory hinges on whether the overbought RSI triggers profit-taking or if momentum carries it toward 329.11 (R1). A break above this level could accelerate toward the 20-day dynamic resistance (333.25), while failure to hold above 323.86 (20-day dynamic support) may signal a deeper correction. The next key catalyst is whether European session flows sustain the bullish bias or if overextension finally weighs on the rally.
Disclaimer
The content on MarketsFN.com is provided for educational and informational purposes only and does not constitute financial advice. All investments involve risk and past performance does not guarantee future results.