USD/THB: Down 0.15% to 33.5180 — Ascending Channel
MarketsFN Team
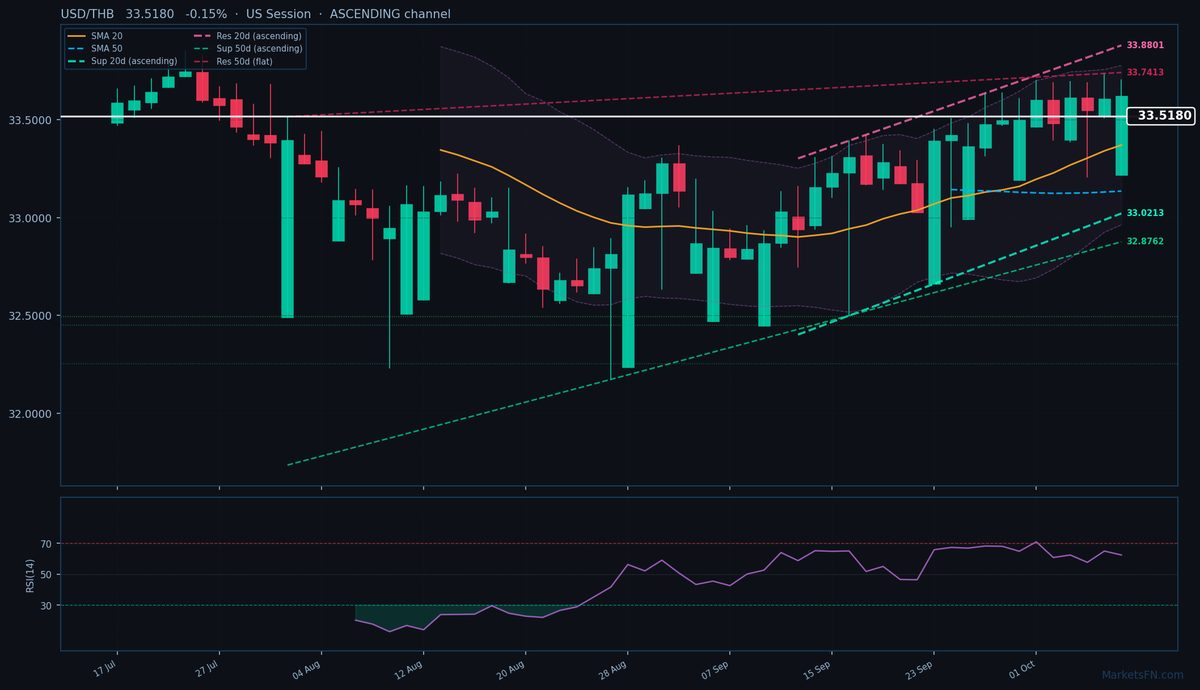
USD/THB: Down 0.15% to 33.5180 — Ascending Channel
Published: October 09, 2026 · MarketsFN Team · US Session · Emerging FX
| Pair | Rate | Change | RSI(14) | SMA-20 | SMA-50 | 52W High | 52W Low | Pivot | R1 | S1 |
|---|---|---|---|---|---|---|---|---|---|---|
| USD/THB | 33.5180 | -0.15% | 62.5 | 33.3705 | 33.1355 | 33.7470 | 30.5160 | 33.6183 | 33.7267 | 33.4997 |
S/R Support & Resistance Levels
Dynamic Trendlines
| Level | Type | Direction | Distance |
|---|---|---|---|
| 33.0213 | 20d Support | up (ascending) | -1.48% / 4967.1 pips |
| 33.8801 | 20d Resistance | up (ascending) | +1.08% / 3621.5 pips |
| 32.8762 | 50d Support | up (ascending) | -1.91% / 6417.7 pips |
| 33.7413 | 50d Resistance | flat (flat) | +0.67% / 2232.8 pips |
Static Levels
| Level | Type | Touches | Distance |
|---|---|---|---|
| 32.4945 | Support | 2x | -3.35% / 11275.0 pips |
| 32.4505 | Support | 2x | -3.48% / 11715.0 pips |
| 32.2535 | Support | 2x | -4.07% / 13685.0 pips |
USD/THB is trading at 33.5180 (-0.15%), consolidating near the upper bound of its 52-week range (30.5160 – 33.7470) as the pair maintains its bullish bias. The rate remains above both the 20-day (33.3705) and 50-day (33.1355) SMAs, confirming the uptrend, though today’s slight pullback suggests mild profit-taking after testing the year-to-date high of 33.7470. The 20-day dynamic channel is ascending, with immediate resistance at 33.8801 (+3621.5 pips) and support at 33.0213 (-4967.1 pips). The 50-day channel also slopes upward, with resistance at 33.7413 (+2232.8 pips) — a critical level to watch given its proximity to the YTD peak.
Static levels show S1 at 33.4997 (-182.3 pips) and R1 at 33.7267 (+2087.0 pips), with the latter aligning closely with the 50-day dynamic resistance, reinforcing its significance. RSI(14) at 62.5 suggests neutral momentum, leaving room for further upside if bullish pressure resumes. However, the pair’s failure to breach 33.7470 this week signals potential exhaustion, and a break below S1 could trigger a deeper retracement toward the 20-day SMA.
Short-term, the ascending channel favors buyers, but the lack of fresh catalysts and elevated RSI warrants caution. A decisive close above 33.7470 would confirm continuation toward 34.0000 psychological resistance, while a drop below 33.3705 (20-day SMA) may signal a correction. Watch for USD momentum shifts during the US session, as thin liquidity in Asian hours has exaggerated recent moves.
Disclaimer
The content on MarketsFN.com is provided for educational and informational purposes only and does not constitute financial advice. All investments involve risk and past performance does not guarantee future results.