USD/CHF: Up 0.75% to 0.8128 — Bullish — Above Key MAs
MarketsFN Team
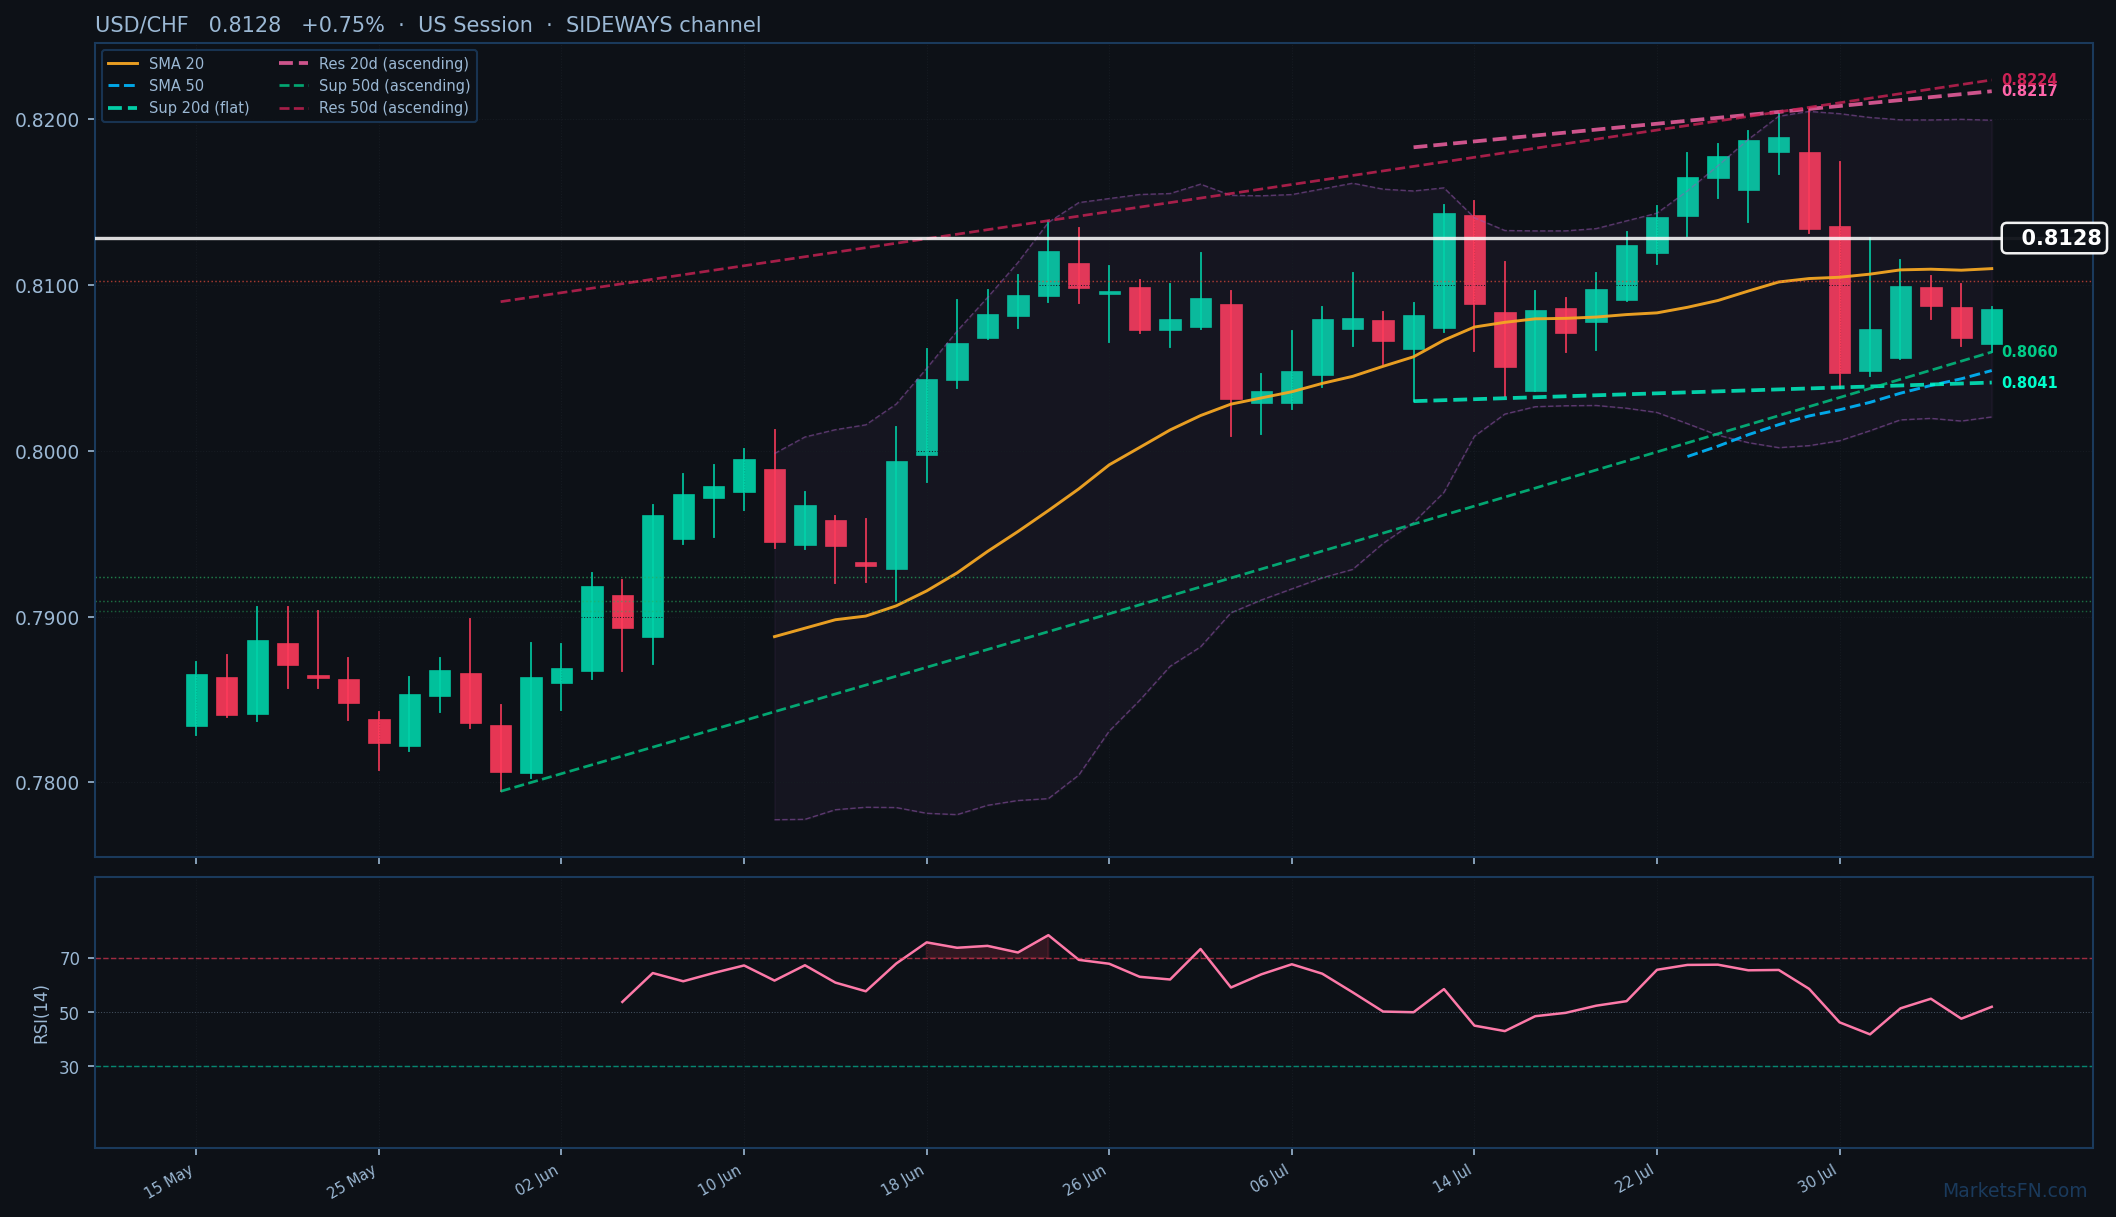
USD/CHF: Up 0.75% to 0.8128 — Bullish — Above Key MAs
Published: August 06, 2026 · MarketsFN Team · US Session
| Pair | Rate | Change | RSI(14) | SMA-20 | SMA-50 | 52W High | 52W Low | Pivot | R1 | S1 |
|---|---|---|---|---|---|---|---|---|---|---|
| USD/CHF | 0.8128 | +0.75% | 52.0 | 0.8110 | 0.8048 | 0.8189 | 0.7609 | 0.8077 | 0.8091 | 0.8054 |
📊 Support & Resistance Levels
Dynamic Trendlines
| Level | Type | Direction | Distance |
|---|---|---|---|
| 0.8041 | 20d Support | → flat | -1.07% / 87.2 pips |
| 0.8217 | 20d Resistance | ↗ ascending | +1.09% / 88.6 pips |
| 0.8060 | 50d Support | ↗ ascending | -0.85% / 68.7 pips |
| 0.8224 | 50d Resistance | ↗ ascending | +1.17% / 95.4 pips |
Static Levels
| Level | Type | Touches | Distance |
|---|---|---|---|
| 0.8102 | Resistance | 2× | +0.21% / 16.9 pips |
| 0.7924 | Support | 2× | -2.00% / 161.4 pips |
| 0.7910 | Support | 2× | -2.17% / 175.7 pips |
| 0.7904 | Support | 2× | -2.25% / 181.9 pips |
USD/CHF is trading at 0.8128 (+0.75%) as it continues to show strength above its moving averages, with the 20-day SMA at 0.8110 and the 50-day SMA at 0.8048. This positioning indicates an uptrend, supported by the current price being above both moving averages. The dynamic channel analysis reveals a flat 20-day dynamic support trendline at 0.8041, which is 87.2 pips below the current rate, while the ascending 20-day dynamic resistance trendline is at 0.8217, 88.6 pips above. The 50-day dynamic support trendline is also ascending at 0.8060, 68.7 pips below, further reinforcing the bullish sentiment.
On the static level front, the nearest resistance is R1 at 0.8102, just 16.9 pips away, while the closest support level is S1 at 0.7924, significantly further at 161.4 pips below. The RSI(14) is currently at 52.0, indicating neutral momentum, which suggests that while the market is not overbought, there is potential for further upward movement.
In the short term, the outlook remains positive as the price holds above key moving averages and dynamic support levels. A break above the static resistance at 0.8102 could pave the way for a test of the dynamic resistance at 0.8217. Conversely, a drop below the dynamic support at 0.8041 would signal a potential reversal, warranting caution among traders.
Disclaimer
The content on MarketsFN.com is provided for educational and informational purposes only and does not constitute financial advice. All investments involve risk and past performance does not guarantee future results.


