USD/CHF: Up 0.68% to 0.8094 — Descending Channel
MarketsFN Team
USD/CHF: Up 0.68% to 0.8094 — Descending Channel
Published: August 28, 2026 · MarketsFN Team · US Session
| Pair | Rate | Change | RSI(14) | SMA-20 | SMA-50 | 52W High | 52W Low | Pivot | R1 | S1 |
|---|---|---|---|---|---|---|---|---|---|---|
| USD/CHF | 0.8094 | +0.68% | 42.2 | 0.8072 | 0.8087 | 0.8189 | 0.7609 | 0.8043 | 0.8057 | 0.8025 |
📊 Support & Resistance Levels
Dynamic Trendlines
| Level | Type | Direction | Distance |
|---|---|---|---|
| 0.7900 | 20d Support | ↘ descending | -2.40% / 194.0 pips |
| 0.8090 | 20d Resistance | ↘ descending | -0.05% / 4.3 pips |
| 0.7939 | 50d Support | ↘ descending | -1.92% / 155.6 pips |
| 0.8218 | 50d Resistance | → flat | +1.53% / 123.9 pips |
Static Levels
| Level | Type | Touches | Distance |
|---|---|---|---|
| 0.8102 | Resistance | 2× | +0.72% / 58.1 pips |
| 0.7924 | Support | 2× | -1.49% / 120.1 pips |
| 0.7910 | Support | 2× | -1.67% / 134.5 pips |
| 0.7904 | Support | 2× | -1.75% / 140.7 pips |
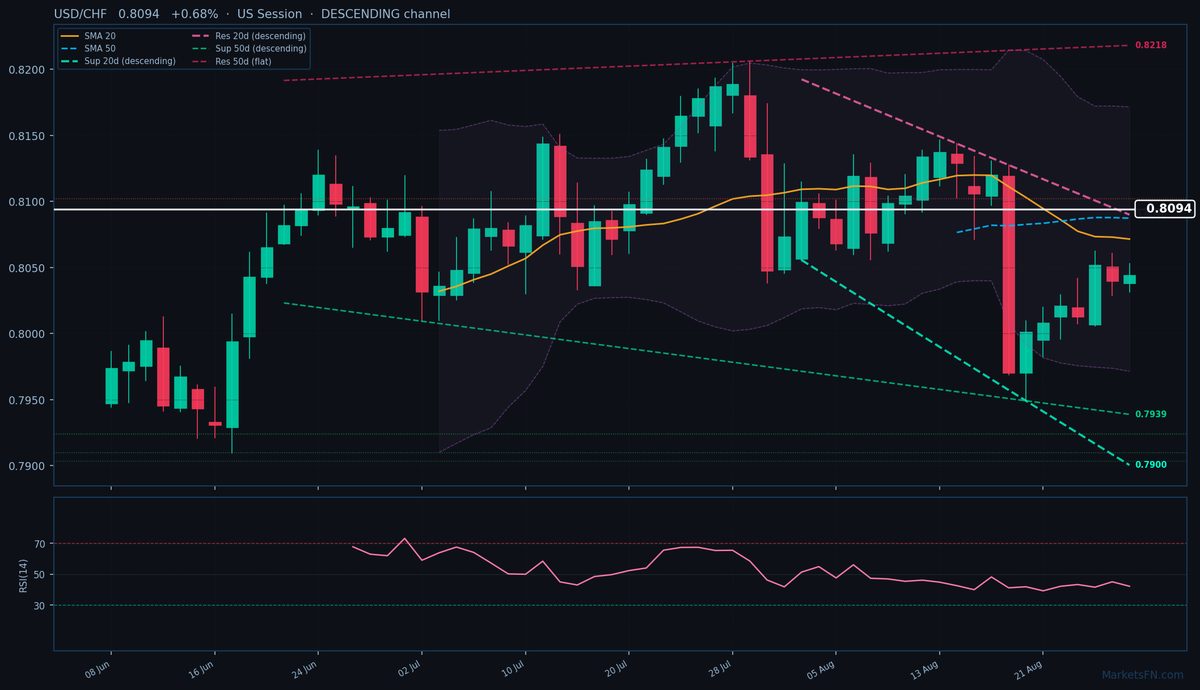
USD/CHF is trading at 0.8094 (+0.68%), breaking above both the 20-day (0.8072) and 50-day (0.8087) SMAs in a bullish signal, though the pair remains trapped in a descending 20-day channel with resistance just 4.3 pips overhead at 0.8090. The 50-day channel paints a more neutral picture with flat resistance at 0.8218 (123.9 pips away), while dynamic support sits at 0.7939 (-155.6 pips). Static levels show immediate upside potential to R1 at 0.8102 (58.1 pips away), though the 52-week high of 0.8189 looms as a more significant barrier. Downside protection appears weaker, with S1 at 0.7924 (120.1 pips below) untested since early August.
The RSI at 42.2 suggests neutral momentum, neither overbought nor oversold, leaving room for continuation if USD bulls can push through the descending 20-day resistance. Today's +0.68% move on a narrow 22-pip range (0.8031-0.8053) indicates compressed volatility, with the ATR(14) at just 0.0049. The breakout above both SMAs favors upside, but the descending 20-day channel warns of potential rejection near 0.8090. A confirmed break above this dynamic resistance would target R1 at 0.8102, while failure could see a retest of the 50-day SMA at 0.8087. Watch for US session momentum to confirm whether this is a genuine breakout or another false move in the pair's broader downtrend. The next catalyst is the 20-day resistance test — a close above 0.8090 would invalidate the descending channel and signal trend reversal.
Disclaimer
The content on MarketsFN.com is provided for educational and informational purposes only and does not constitute financial advice. All investments involve risk and past performance does not guarantee future results.