USD/CHF: Up 0.08% to 0.8112 — Price Below SMA-20
MarketsFN Team
USD/CHF: Up 0.08% to 0.8112 — Price Below SMA-20
Published: August 18, 2026 · MarketsFN Team · US Session
| Pair | Rate | Change | RSI(14) | SMA-20 | SMA-50 | 52W High | 52W Low | Pivot | R1 | S1 |
|---|---|---|---|---|---|---|---|---|---|---|
| USD/CHF | 0.8112 | +0.08% | 47.5 | 0.8120 | 0.8082 | 0.8189 | 0.7609 | 0.8104 | 0.8136 | 0.8074 |
📊 Support & Resistance Levels
Dynamic Trendlines
| Level | Type | Direction | Distance |
|---|---|---|---|
| 0.8069 | 20d Support | ↗ ascending | -0.53% / 43.3 pips |
| 0.8133 | 20d Resistance | ↘ descending | +0.26% / 21.1 pips |
| 0.8075 | 50d Support | ↗ ascending | -0.45% / 36.9 pips |
| 0.8246 | 50d Resistance | ↗ ascending | +1.65% / 133.8 pips |
Static Levels
| Level | Type | Touches | Distance |
|---|---|---|---|
| 0.7924 | Support | 2× | -2.36% / 191.2 pips |
| 0.7910 | Support | 2× | -2.53% / 205.6 pips |
| 0.7904 | Support | 2× | -2.61% / 211.8 pips |
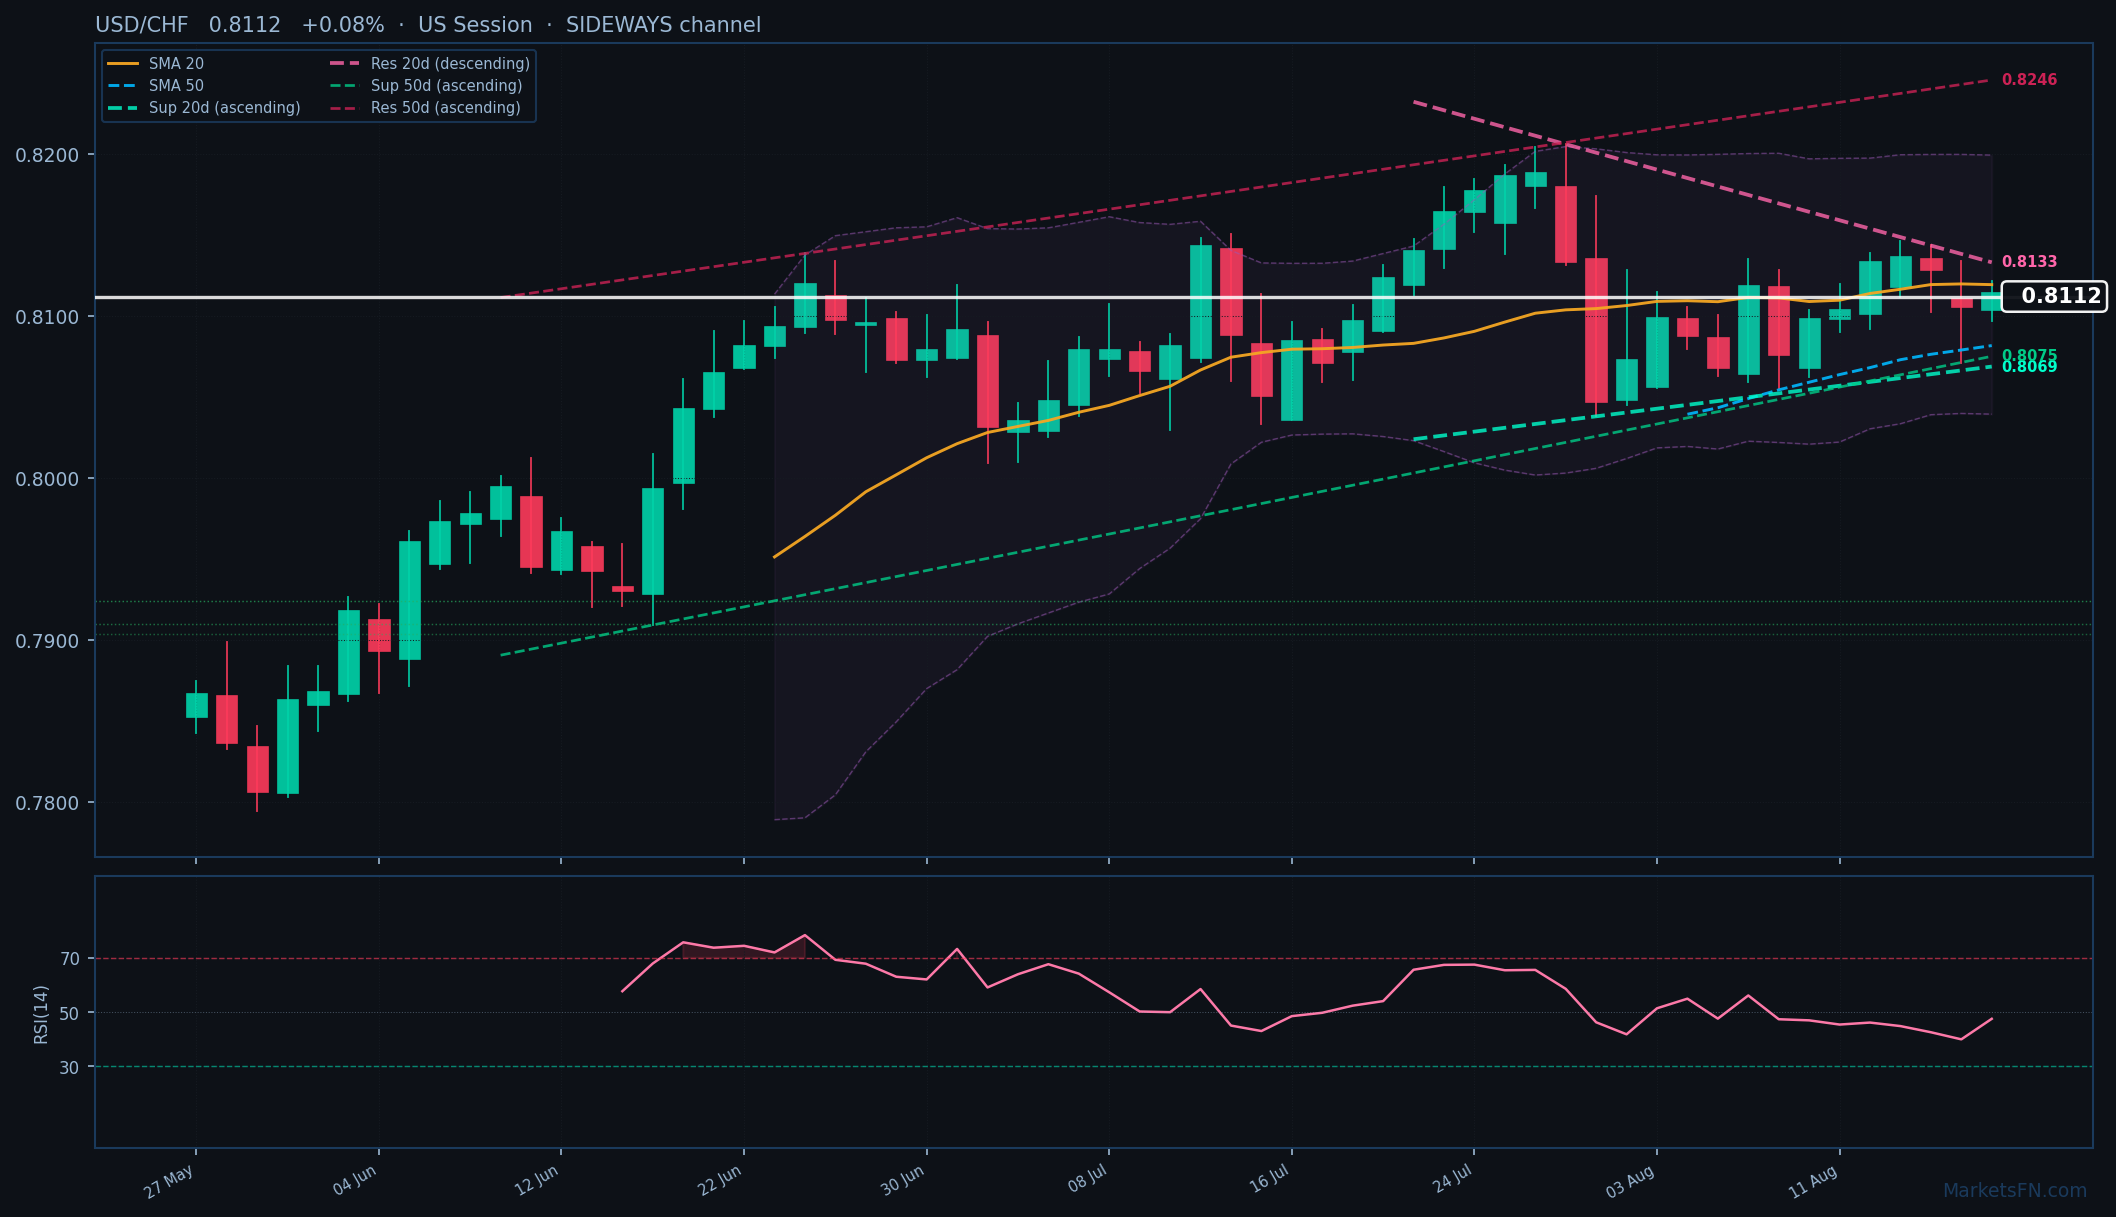
USD/CHF is trading at 0.8112 (+0.08%) as it continues to navigate a consolidation phase. The current rate is positioned below the 20-day simple moving average (SMA) of 0.8120, indicating a slight bearish sentiment in the short term, while it remains above the 50-day SMA of 0.8082, suggesting some underlying support. The dynamic trendlines reveal an ascending 20-day support trendline at 0.8069, which is 43.3 pips below the current rate, and a descending 20-day resistance trendline at 0.8133, just 21.1 pips above.
In terms of static levels, the closest resistance is at R1, positioned at 0.8136, which is 24 pips above the current price, while the nearest support level, S1, is at 0.8074, 38 pips below. The RSI at 47.5 indicates that the market is in neutral territory, reflecting a lack of strong momentum in either direction.
Looking ahead, the USD/CHF appears to be caught in a tight range, with potential for a breakout either way. A move above the dynamic resistance at 0.8133 could signal a bullish shift, while a drop below the dynamic support at 0.8069 would likely confirm bearish sentiment. Traders should watch for price action around these key levels to gauge the next directional move.
Disclaimer
The content on MarketsFN.com is provided for educational and informational purposes only and does not constitute financial advice. All investments involve risk and past performance does not guarantee future results.