USD/MXN: Down 0.70% to 17.9450 — RSI Overbought
MarketsFN Team
USD/MXN: Down 0.70% to 17.9450 — RSI Overbought
Published: October 06, 2026 · MarketsFN Team · US Session · Emerging FX
| Pair | Rate | Change | RSI(14) | SMA-20 | SMA-50 | 52W High | 52W Low | Pivot | R1 | S1 |
|---|---|---|---|---|---|---|---|---|---|---|
| USD/MXN | 17.9450 | -0.70% | 71.5 | 17.5354 | 17.2513 | 18.6856 | 16.8835 | 18.1311 | 18.1995 | 18.0030 |
S/R Support & Resistance Levels
Dynamic Trendlines
| Level | Type | Direction | Distance |
|---|---|---|---|
| 17.9081 | 20d Support | up (ascending) | -0.21% / 368.4 pips |
| 18.7262 | 20d Resistance | up (ascending) | +4.35% / 7812.4 pips |
| 17.0330 | 50d Support | up (ascending) | -5.08% / 9120.0 pips |
| 18.4887 | 50d Resistance | up (ascending) | +3.03% / 5437.4 pips |
Static Levels
| Level | Type | Touches | Distance |
|---|---|---|---|
| 18.8632 | Resistance | 2x | +5.11% / 9175.8 pips |
| 18.0365 | Resistance | 2x | +0.51% / 908.5 pips |
| 17.8683 | Support | 2x | -0.43% / 773.2 pips |
| 17.1529 | Support | 2x | -4.42% / 7927.5 pips |
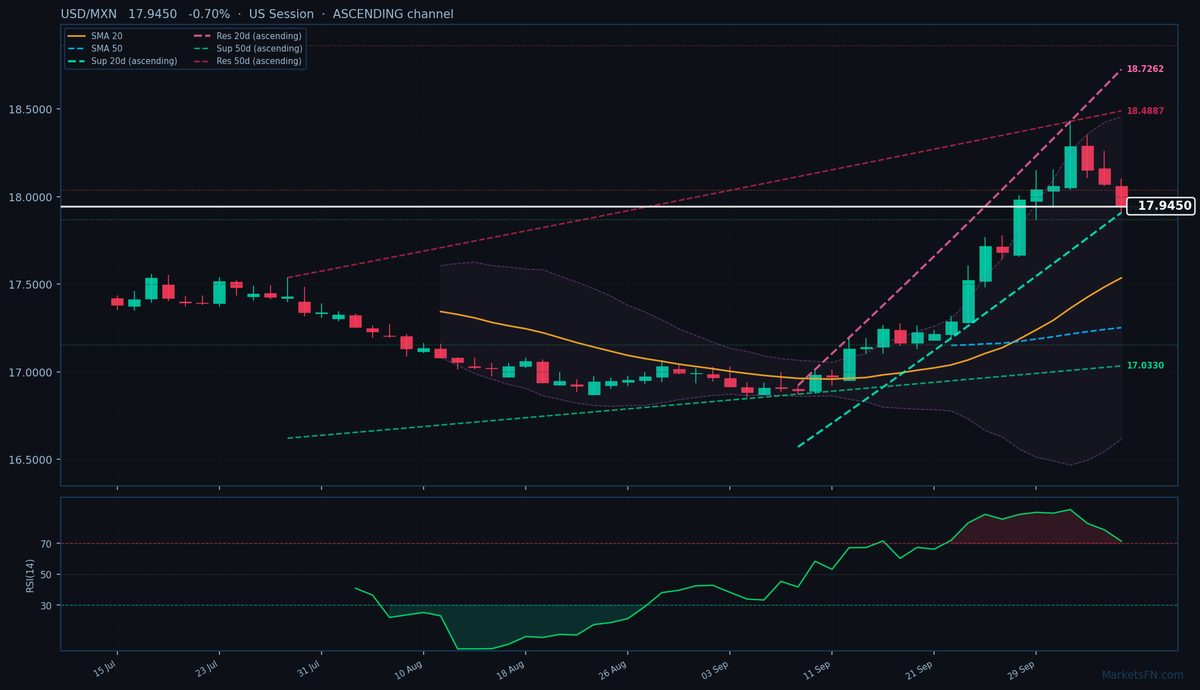
USD/MXN is trading at 17.9450 (-0.70%), retreating from yesterday's close of 18.0714 but holding firmly above both the 20-day SMA (17.5354) and 50-day SMA (17.2513), confirming the pair's entrenched uptrend. The daily range (17.9081–18.0982) shows sellers defending the 18.10 psychological level, while buyers stepped in near the 20-day dynamic support trendline at 17.9081 — an ascending channel that sits just 368.4 pips below current price. The 20-day dynamic resistance at 18.7262 (ascending, +4.35%) remains distant at 7,812.4 pips overhead, suggesting room for further upside if momentum resumes.
Static levels reveal immediate resistance at R1 (18.0365, 908.5 pips away) and support at S1 (17.8683, 773.2 pips below), with the latter aligning closely with today's low. The RSI at 71.5 flags overbought conditions, but the ascending channel structure and SMA positioning suggest pullbacks may be shallow. With the 20-day ATR at 0.2159, today's decline (-0.70%) is within normal volatility bounds.
Short-term, the pair's ability to hold above 17.9081 (dynamic support) will dictate whether this is a healthy consolidation or the start of a deeper correction. A break below S1 (17.8683) could trigger profit-taking toward 17.5354 (20-day SMA), while reclaiming 18.0365 (R1) would reaffirm bullish control. Watch European session flows for directional cues — a close above 18.00 would neutralize today's bearish momentum.
Disclaimer
The content on MarketsFN.com is provided for educational and informational purposes only and does not constitute financial advice. All investments involve risk and past performance does not guarantee future results.