USD/CHF: Down 0.13% to 0.8081 — Descending Channel
MarketsFN Team
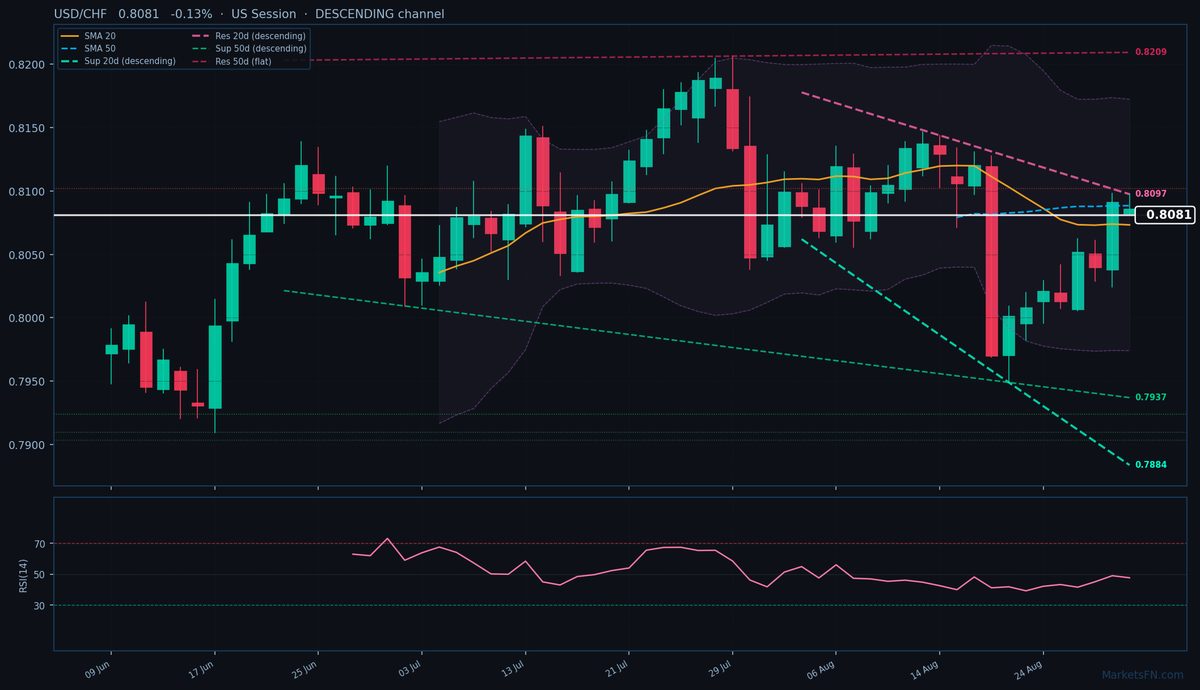
USD/CHF: Down 0.13% to 0.8081 — Descending Channel
Published: August 31, 2026 · MarketsFN Team · US Session
| Pair | Rate | Change | RSI(14) | SMA-20 | SMA-50 | 52W High | 52W Low | Pivot | R1 | S1 |
|---|---|---|---|---|---|---|---|---|---|---|
| USD/CHF | 0.8081 | -0.13% | 47.7 | 0.8073 | 0.8088 | 0.8189 | 0.7609 | 0.8071 | 0.8118 | 0.8044 |
📊 Support & Resistance Levels
Dynamic Trendlines
| Level | Type | Direction | Distance |
|---|---|---|---|
| 0.7884 | 20d Support | ↘ descending | -2.44% / 197.2 pips |
| 0.8097 | 20d Resistance | ↘ descending | +0.20% / 16.4 pips |
| 0.7937 | 50d Support | ↘ descending | -1.78% / 144.0 pips |
| 0.8209 | 50d Resistance | → flat | +1.59% / 128.2 pips |
Static Levels
| Level | Type | Touches | Distance |
|---|---|---|---|
| 0.8102 | Resistance | 2× | +0.20% / 16.1 pips |
| 0.7924 | Support | 2× | -2.01% / 162.1 pips |
| 0.7910 | Support | 2× | -2.18% / 176.5 pips |
| 0.7904 | Support | 2× | -2.26% / 182.7 pips |
USD/CHF is trading at 0.8081 (-0.13%), hovering in a tight consolidation phase between the 20-day SMA (0.8073, support) and 50-day SMA (0.8088, resistance). The pair is trapped in a descending 20-day channel, with immediate dynamic resistance at 0.8097 (+16.4 pips) and dynamic support far below at 0.7884 (-197.2 pips). The broader 50-day channel is sideways, with resistance at 0.8209 (+128.2 pips) and support at 0.7937 (-144.0 pips), reflecting indecision after the recent downtrend.
Static levels show a clear asymmetry: resistance at R1 (0.8102, +16.1 pips) is within striking distance, while the nearest meaningful support cluster (S1 at 0.7924, -162.1 pips) remains distant. This suggests vulnerability to a near-term upside test if the pair breaks above the 50-day SMA, though weak RSI momentum (47.7, neutral) and the descending 20-day channel slope argue against sustained bullish conviction.
The short-term outlook hinges on whether USD/CHF can reclaim the 50-day SMA (0.8088) and challenge R1 (0.8102). Failure here would likely retest the 20-day SMA (0.8073) and pivot (0.8071). Watch for a close above 0.8097 (20-day dynamic resistance) to signal a potential reversal of the descending channel, while a break below 0.8071 would confirm bearish continuation toward the 0.7924–0.7904 support zone. The US session’s price action relative to these levels will dictate near-term direction.
Disclaimer
The content on MarketsFN.com is provided for educational and informational purposes only and does not constitute financial advice. All investments involve risk and past performance does not guarantee future results.