US Session Crude Oil Report — 14 Oct 2026
QuoteReporter
WTI crude is trading at $90.86 in the NYMEX session, down 0.27% on the day as it struggles to rebound from oversold conditions, with RSI(14) at 22.5 signaling extreme bearish exhaustion. Brent holds firmer at $103.02, up 0.75%, as the Brent-WTI spread widens to $12.16 amid tighter Atlantic Basin fundamentals. Both benchmarks remain under pressure on the week, down 3.96% and 3.36% respectively, as demand concerns counter supply risks.
Technicals paint a mixed picture. WTI tests its EMA50 at $90.23 but faces resistance from the descending EMA9 ($92.34) and EMA21 ($92.90), while Brent hovers near its EMA9 at $103.07. The pivot point at $89.46 acts as critical support for WTI, with a break risking a test of $72.17 (S1). Brent’s PP at $96.17 remains distant, but the contract shows relative strength, buoyed by European refinery demand. The term structure reinforces tight near-term supply, with WTI in steep backwardation (-10.8% Oct26-Jul27) and Brent even steeper at -14.6%.

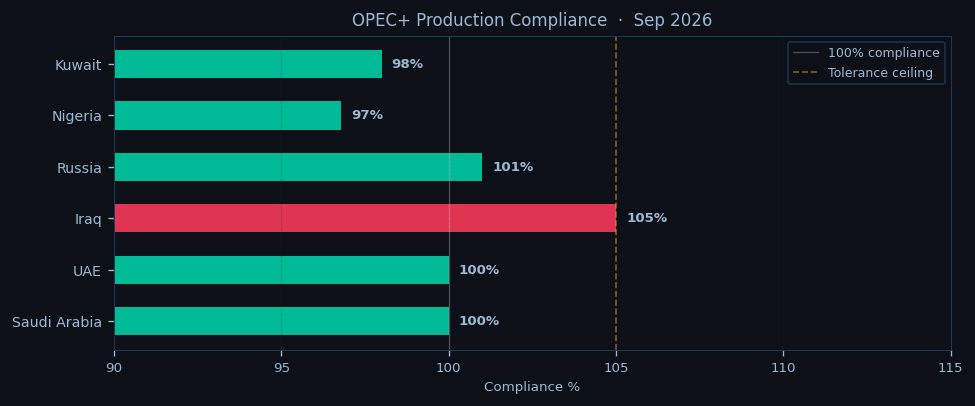
Geopolitical tensions simmer beneath the price action. The Hormuz chokepoint remains elevated as IRGC naval activity disrupts tanker flows, while Houthi attacks in Bab-el-Mandeb force VLCCs onto longer Cape routes. OPEC+ discipline provides a floor, with the group maintaining cuts through December 2026. The market faces a 0.6 mb/d deficit as Saudi holds full compliance, though Iraq and Russia continue slight overproduction. Today’s EIA data shows a marginal 0.9 mb crude build, but draws in products and refinery runs at 92.5% suggest resilient demand. Cushing inventories at 24.3 mb keep Midland delivery risks contained.
The session outlook hinges on whether WTI can defend $90. A break below risks a flush toward $86.50, where algorithmic selling may accelerate. Brent’s resilience above $102 keeps the upside open, with $104.50 (R1) the next hurdle. Asian session traders will watch for follow-through, with overnight levels set at $89.50/$92.50 for WTI and $101.80/$104.20 for Brent. The backwardation curve suggests physical tightness persists, but macro fears linger—any rebound needs confirmation from equity markets and the dollar. For now, crude trades on a knife’s edge, balancing geopolitics against recession whispers.

Disclaimer
The content on MarketsFN.com is provided for educational and informational purposes only. It does not constitute financial advice, investment recommendations, or trading guidance. All investments involve risks, and past performance does not guarantee future results. You are solely responsible for your investment decisions and should conduct independent research and consult a qualified financial advisor before acting. MarketsFN.com and its authors are not liable for any losses or damages arising from your use of this information.
Related Articles
- Chile Earthquake Disrupts Copper Supply — Earthquake in Chilean Copper Belt: A Potential Supply Shock In the early hours of October 14, 2026, a magnitude 5.1…
- European Session Crude Oil Report — 14 Oct 2026 — Crude oil markets remain under pressure in the European session as WTI hovers near $90.86 while Brent struggles to hold…
- US Session Crude Oil Report — 13 Oct 2026 — WTI crude is trading at $90.86 in early New York session action, holding near its pivot point at $89.46 as the market…
- European Session Crude Oil Report — 13 Oct 2026 — Crude oil markets trade mixed in the European session as Brent holds above $103 while WTI struggles near $90.80, with…
- US Session Crude Oil Report — 12 Oct 2026 — WTI crude is trading at $90.86 in early US session action, holding near session lows as the contract extends its…