US Session Crude Oil Report — 12 Oct 2026
QuoteReporter
WTI crude is trading at $90.86 in early US session action, holding near session lows as the contract extends its week-to-date decline to nearly 4%. Brent crude shows relative strength at $103.02, narrowing the Brent-WTI spread to $12.16 as the global benchmark finds support from tightening Atlantic Basin physical markets. Both contracts remain in steep backwardation with front-month WTI trading $10 below the October 2026 contract, signaling persistent near-term supply concerns.
The technical setup reveals diverging momentum, with WTI's RSI at oversold 22.5 while Brent's 38.9 reading suggests room for further downside. WTI faces immediate resistance at the 9-day EMA ($92.34) with the 50-day EMA ($90.23) now acting as tenuous support. Brent’s chart shows more constructive positioning, trading just below its 9-day EMA ($103.07) with the 50-day EMA ($97.21) providing a distant floor. The term structure continues flashing warning signs, with July 2027 contracts trading at steep discounts to prompt dates in both benchmarks – backwardation steepens to -14.6% in Brent versus -10.8% in WTI as deferred contracts price in eventual OPEC+ supply returns.

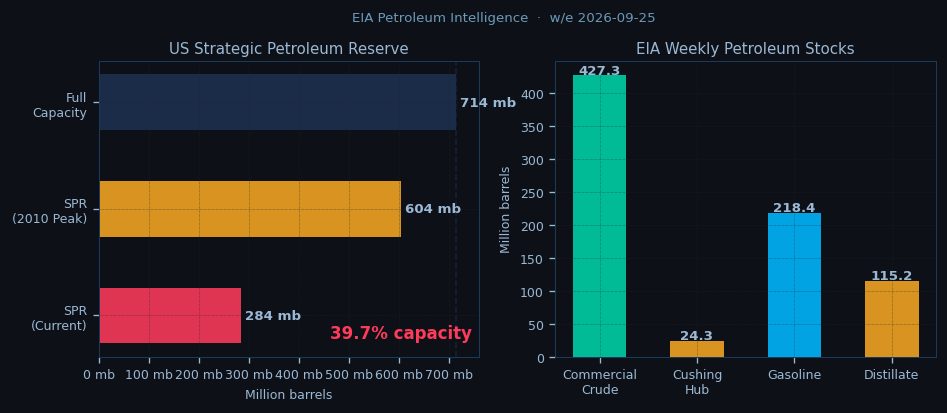
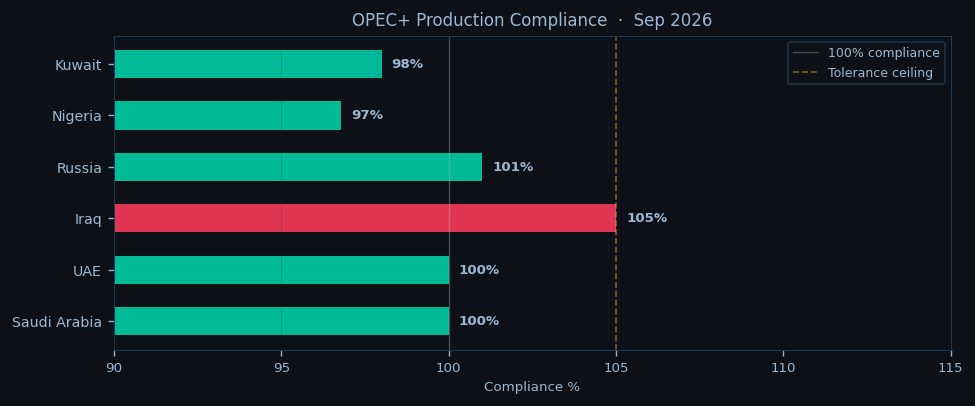
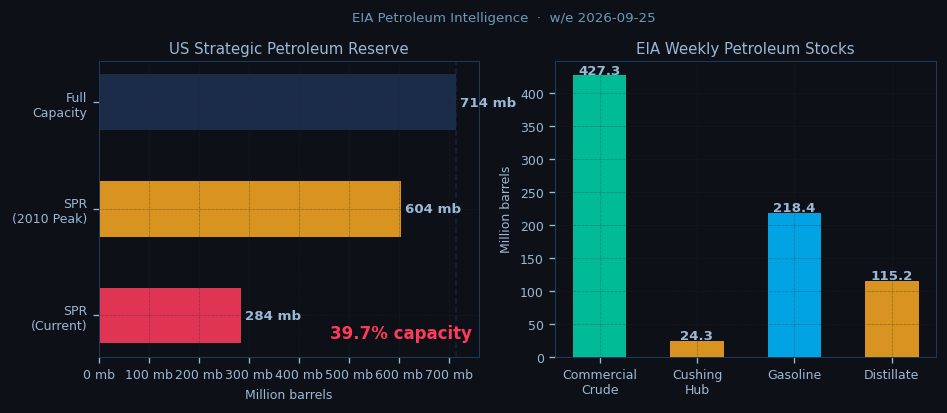
Geopolitical tensions maintain a bid under crude, with Iranian Revolutionary Guard Corps naval activity in the Strait of Hormuz keeping risk premiums elevated. Market participants monitor Houthi missile capabilities near Bab-el-Mandeb, where VLCC diversions around Africa add $1.50-$2.00 per barrel to freight costs. OPEC+ discipline remains the dominant fundamental driver, with the group’s September compliance at 98% as Saudi Arabia compensates for Iraq and Russia’s 110% quota busting. The physical market tightness reflects in EIA data showing Cushing inventories at 24.3 million barrels – hovering near operational minimums – while US refinery runs hold at 92.5% of capacity despite autumn maintenance season.
Today’s US session focus remains on whether WTI defends its 50-day EMA as algorithmic selling pressures the contract. Brent’s relative strength suggests fund managers view the global benchmark as better positioned to weather potential SPR releases or OPEC+ quota adjustments. The overnight Asian session will key off whether WTI holds $90.00 psychological support, with a break risking momentum selling toward $88.50. Upside remains capped near $92.50 until the oversold RSI resets. For Brent, the $102-$104 range contains most early session activity, with options barriers reported at $105.00. Market structure continues favoring prompt tightness, with the Oct/Nov WTI spread holding backwardation at -$0.38 despite the broader selloff.
The crude complex remains torn between technical oversold conditions and fundamental supply anxieties. While OPEC+ maintains production discipline, the lack of fresh geopolitical escalations allows profit-taking after Q3’s 28% rally. All eyes turn to tomorrow’s EIA inventory data for confirmation whether US stock draws can offset weakening macro sentiment. For now, the algorithms dominate as WTI tests the lower bounds of its 3-month range while Brent’s stronger structure keeps the global benchmark more resilient to speculative flows.

Disclaimer
The content on MarketsFN.com is provided for educational and informational purposes only. It does not constitute financial advice, investment recommendations, or trading guidance. All investments involve risks, and past performance does not guarantee future results. You are solely responsible for your investment decisions and should conduct independent research and consult a qualified financial advisor before acting. MarketsFN.com and its authors are not liable for any losses or damages arising from your use of this information.
Related Articles
- Indonesian Earthquake Disrupts Nickel Supply — Indonesian Earthquake Disrupts Nickel Supply Chain On October 11, 2026, a magnitude 5.3 earthquake struck 150 km west…
- European Session Crude Oil Report — 12 Oct 2026 — **European Session Crude Oil Report – 05 Oct 2026 11:00 NY** WTI hovers near $90.86, down 0.27% on the session but…
- US Session Crude Oil Report — 09 Oct 2026 — WTI crude is trading at $90.86 in the US session, down 0.27% on the day as it struggles to recover from a steep weekly…
- European Session Crude Oil Report — 09 Oct 2026 — Crude oil markets stabilize in European trade after a volatile Asian session, with Brent holding above $103 while WTI…
- US Session Crude Oil Report — 08 Oct 2026 — WTI crude is trading at $90.86 in early US session action, holding just above the pivotal $89.46 level as the contract…