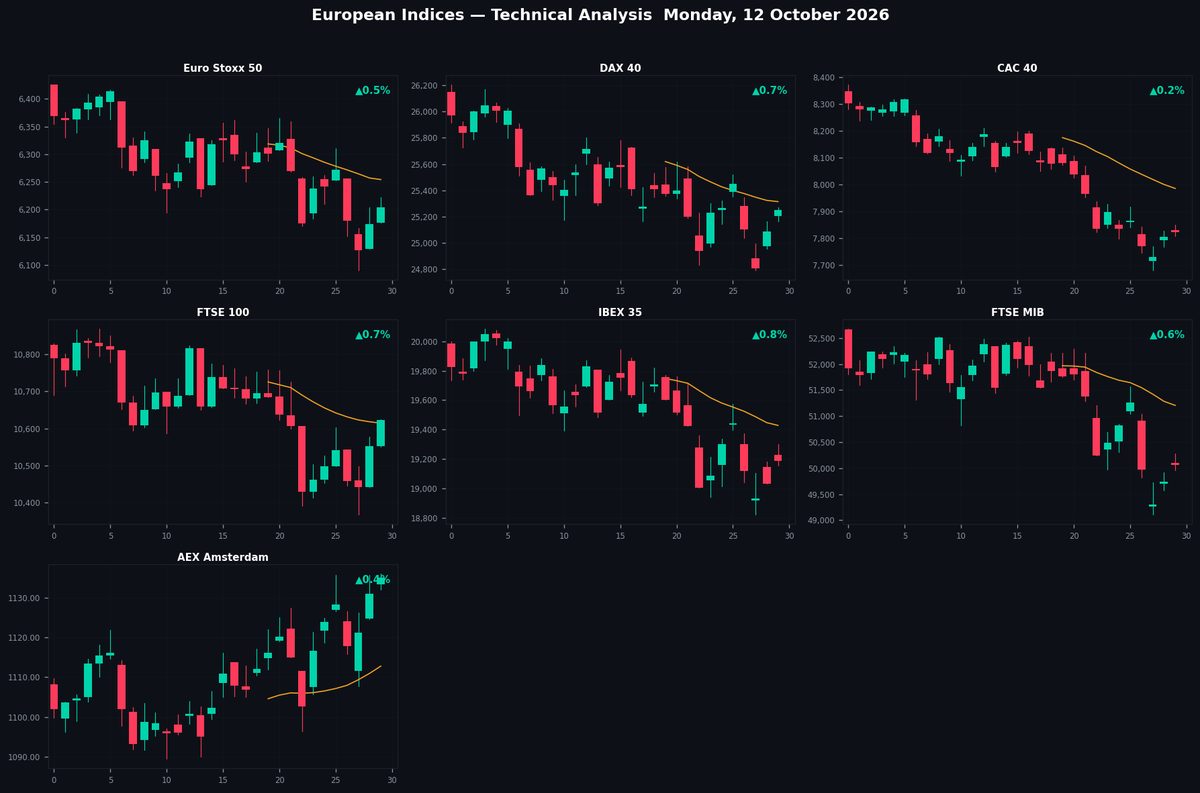
Technical analysis update for the seven major European equity indices on Monday, 12 October 2026.
Charts cover 65 sessions (daily bars) with SMA-20, SMA-50, Bollinger Bands (20,2),
dynamic support/resistance trendlines (20-day and 50-day), and pivot-cluster S/R levels.
| Code |
Index |
Last |
Chg% |
RSI |
52W H |
52W L |
| STOXX50 | Euro Stoxx 50 | 6,204 | ▲0.49% | 39.3 | 6,577 | 5,377 |
| DAX | DAX 40 | 25,251 | ▲0.65% | 43.6 | 26,619 | 21,864 |
| CAC40 | CAC 40 | 7,821 | ▲0.23% | 39.1 | 8,755 | 7,505 |
| FTSE100 | FTSE 100 | 10,623 | ▲0.67% | 51.1 | 10,990 | 9,277 |
| IBEX35 | IBEX 35 | 19,188 | ▲0.82% | 44.2 | 20,356 | 15,409 |
| FTSEMIB | FTSE MIB | 50,061 | ▲0.63% | 34.0 | 54,042 | 41,360 |
| AEX | AEX Amsterdam | 1,134.94 | ▲0.35% | 49.2 | 1,136.11 | 916.79 |
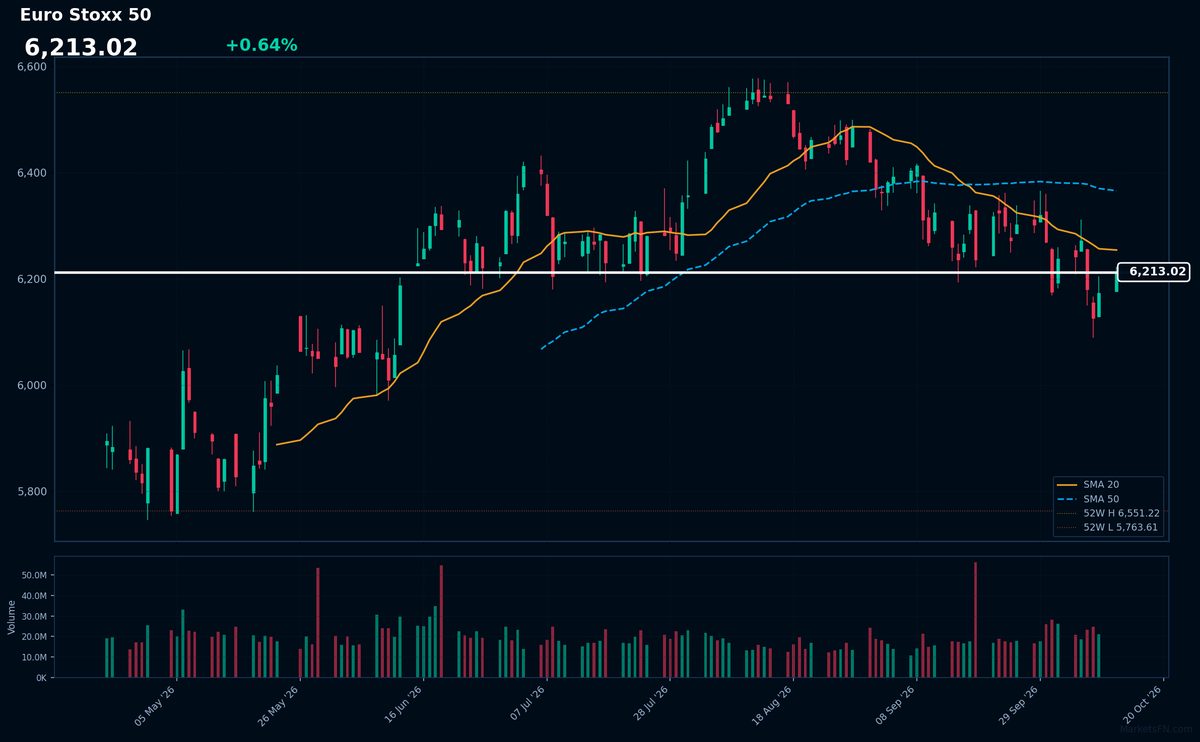
STOXX50
Euro Stoxx 50
6,204
▲0.49%
RSI 39

Double Top — Bearish 65%Double Bottom — Bullish 65%Flag — Bullish 65%Trendlines — Neutral 65%
20d: Sup descending 6,078 (-2.0%) Res descending 6,315 (+1.8%)
50d: Sup descending 6,040 (-2.6%) Res descending 6,308 (+1.7%)
S/R Levels
| R1 | 6,538 | +5.4% | ★★★★★ |
| R2 | 6,369 | +2.7% | ★★★★☆ |
|
6,204
52W 5,377–6,577
|
| S1 | 5,438 | -12.3% | ★★★★★ |
| S2 | 5,975 | -3.7% | ★★★★☆ |
| S3 | 6,188 | -0.3% | ★★★☆☆ |
Moving Averages
| SMA 20 | 6,254 | below -0.8% |
| SMA 50 | 6,366 | below -2.6% |
| SMA 200 | 6,091 | above +1.8% |
Price below SMA20 & SMA50 — bearish structure
Price above SMA200 (+1.8%) — long-term uptrend
Analysis
The Euro Stoxx 50 trades at 6,204, up 0.49%, but remains below key moving averages (SMA20 at 6,254, SMA50 at 6,366), indicating short-term bearish pressure. The RSI-14 at 39 suggests mild oversold conditions, though downside risks persist given the confirmed Double Top pattern (65% confidence). Immediate resistance lies at 6,315 (20-day descending trendline), while support is found at 6,078 (20-day descending trendline) and 6,188. The index remains above the SMA200 (6,091), reinforcing a longer-term bullish bias, but a break below 6,040 (50-day support) could accelerate declines toward 5,975. The convergence of bearish patterns and descending trendlines warrants caution unless resistance at 6,369 is reclaimed.
DAX
DAX 40
25,251
▲0.65%
RSI 44

Double Top — Bearish 65%Double Bottom — Bullish 65%Trendlines — Neutral 65%
20d: Sup descending 24,635 (-2.4%) Res descending 25,418 (+0.7%)
50d: Sup descending 24,635 (-2.4%) Res descending 25,363 (+0.4%)
S/R Levels
| R1 | 26,596 | +5.3% | ★★★★★ |
| R2 | 25,900 | +2.6% | ★★★★☆ |
| R3 | 25,497 | +1.0% | ★★★☆☆ |
|
25,251
52W 21,864–26,619
|
| S1 | 23,523 | -6.8% | ★★★★★ |
| S2 | 24,130 | -4.4% | ★★★★☆ |
| S3 | 24,719 | -2.1% | ★★★☆☆ |
Moving Averages
| SMA 20 | 25,315 | below -0.3% |
| SMA 50 | 25,784 | below -2.1% |
| SMA 200 | 24,862 | above +1.6% |
Price below SMA20 & SMA50 — bearish structure
Price above SMA200 (+1.6%) — long-term uptrend
Analysis
The DAX 40 trades at 25,251, up 0.65%, but remains below key moving averages (SMA20 at 25,315, SMA50 at 25,784), signaling short-term bearish pressure. The RSI-14 at 44 suggests neutral-to-weak momentum. A triple double top pattern (65% confidence each) reinforces downside risks, with immediate resistance at 25,497 (R3) and support at 24,719 (S3). Descending trendlines further cap upside near 25,418 (20-day) and 25,363 (50-day). The index holds above the rising SMA200 (24,862), indicating potential long-term support. A break below 24,635 (descending support) could accelerate declines, while reclaiming SMA20 may shift near-term bias. The technical setup favors caution unless bullish reversal signals emerge.
CAC40
CAC 40
7,821
▲0.23%
RSI 39

Double Top — Bearish 65%Double Bottom — Bullish 65%Flag — Bullish 65%Trendlines — Neutral 65%
20d: Sup descending 7,639 (-2.3%) Res descending 7,898 (+1.0%)
50d: Sup descending 7,642 (-2.3%) Res descending 7,980 (+2.0%)
S/R Levels
| R1 | 8,464 | +8.2% | ★★★★★ |
| R2 | 8,266 | +5.7% | ★★★★☆ |
| R3 | 7,984 | +2.1% | ★★★☆☆ |
|
7,821
52W 7,505–8,755
|
| S1 | 7,514 | -3.9% | ★★★★★ |
| S2 | 7,711 | -1.4% | ★★★★☆ |
Moving Averages
| SMA 20 | 7,985 | below -2.1% |
| SMA 50 | 8,263 | below -5.3% |
| SMA 200 | 8,229 | below -5.0% |
Price below SMA20 & SMA50 — bearish structure
Price below SMA200 (-5.0%) — long-term downtrend
Analysis
The CAC 40 trades at 7,821, up 0.23%, but remains in a bearish technical setup. The index sits below all key SMAs (20, 50, 200), confirming a downtrend, with the RSI-14 at 39 indicating oversold conditions but no reversal signal yet. Three double-top patterns (65% confidence each) reinforce bearish pressure. Immediate resistance lies at 7,898 (20-day descending trendline), while support holds at 7,639. A break below 7,514 (S1) could accelerate declines, whereas a move above 7,898 may test 7,980 (50-day resistance). The convergence of descending trendlines and weak momentum suggests limited upside potential unless bullish catalysts emerge.
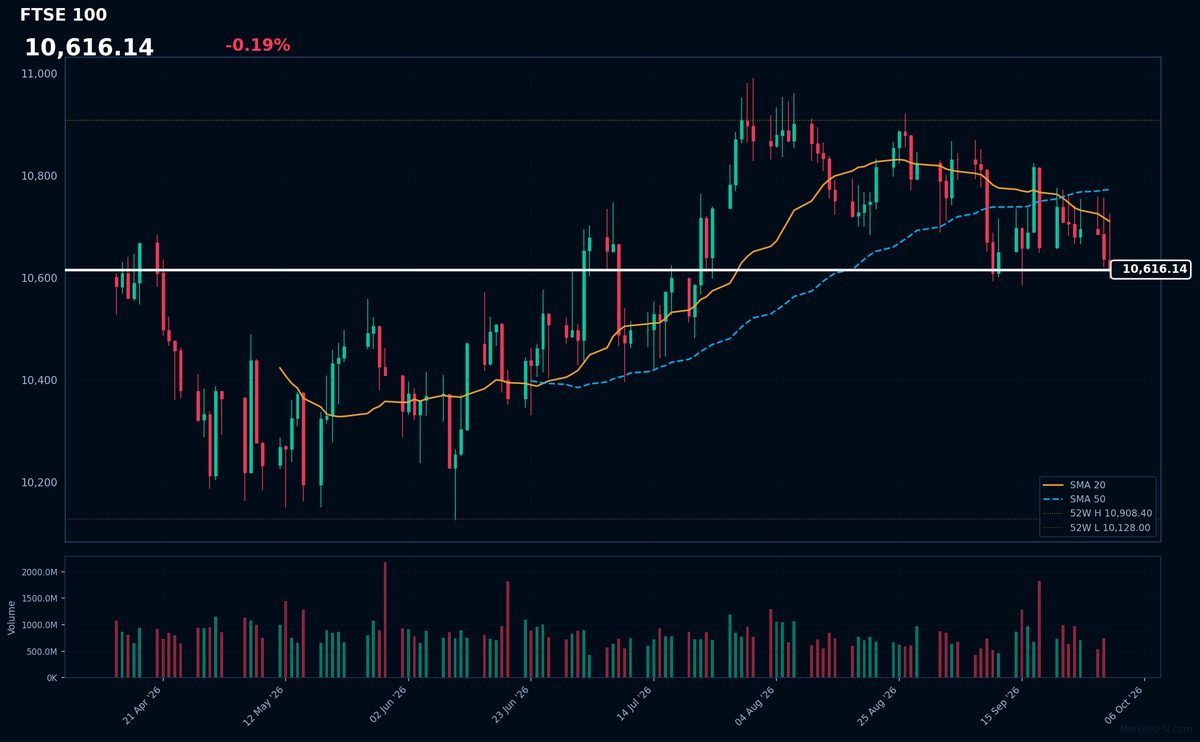
FTSE100
FTSE 100
10,623
▲0.67%
RSI 51

Double Top — Bearish 65%Double Bottom — Bullish 65%Trendlines — Neutral 65%
20d: Sup descending 10,278 (-3.2%) Res descending 10,637 (+0.1%)
50d: Sup descending 10,322 (-2.8%) Res descending 10,705 (+0.8%)
S/R Levels
| R1 | 10,846 | +2.1% | ★★★★★ |
|
10,623
52W 9,277–10,990
|
| S1 | 9,622 | -9.4% | ★★★★★ |
| S2 | 10,115 | -4.8% | ★★★★☆ |
| S3 | 10,374 | -2.3% | ★★★☆☆ |
Moving Averages
| SMA 20 | 10,614 | above +0.1% |
| SMA 50 | 10,724 | below -0.9% |
| SMA 200 | 10,476 | above +1.4% |
Price between SMA20 and SMA50 — mixed signal
Price above SMA200 (+1.4%) — long-term uptrend
Analysis
The FTSE 100 trades at 10,623, up 0.67%, with the RSI-14 at 51 indicating neutral momentum. The index remains below the SMA50 (10,724) but above the SMA200 (10,476), suggesting mixed mid-to-long-term sentiment. Immediate resistance lies at 10,637 (20-day descending trendline), while support is seen at 10,374 (S3) and 10,322 (50-day descending trendline). A bearish Double Top pattern (65% confidence) signals potential downside if the price fails to breach the SMA20 (10,614) decisively. A sustained break above the 20-day resistance could challenge R1 (10,846), but failure may retest lower supports near 10,115 (S2). The broader trend remains cautious amid conflicting technical signals.
IBEX35
IBEX 35
19,188
▲0.82%
RSI 44

Double Top — Bearish 65%Double Bottom — Bullish 65%Trendlines — Neutral 65%
20d: Sup descending 18,739 (-2.3%) Res descending 19,428 (+1.2%)
50d: Sup descending 18,776 (-2.2%) Res descending 19,739 (+2.9%)
S/R Levels
| R1 | 20,342 | +6.0% | ★★★★★ |
| R2 | 20,008 | +4.3% | ★★★★☆ |
| R3 | 19,575 | +2.0% | ★★★☆☆ |
|
19,188
52W 15,409–20,356
|
| S1 | 16,545 | -13.8% | ★★★★★ |
| S2 | 17,468 | -9.0% | ★★★★☆ |
| S3 | 18,015 | -6.1% | ★★★☆☆ |
Moving Averages
| SMA 20 | 19,428 | below -1.2% |
| SMA 50 | 19,760 | below -2.9% |
| SMA 200 | 18,577 | above +3.3% |
Price below SMA20 & SMA50 — bearish structure
Price above SMA200 (+3.3%) — long-term uptrend
Analysis
The IBEX 35 trades at 19,188, up 0.82%, but remains below key moving averages (SMA20: 19,428; SMA50: 19,760), signaling near-term bearish pressure. The RSI-14 at 44 reflects neutral momentum with slight bearish bias. A triple Double Top pattern (65% confidence each) reinforces downside risks, with resistance at R1 (20,342), R2 (20,008), and R3 (19,575). Immediate support lies at S3 (18,015), though stronger levels are at S2 (17,468) and S1 (16,545). Descending trendlines on 20d and 50d charts confirm bearish structure, with resistance at 19,428 (20d) and 19,739 (50d). The index must reclaim SMA200 (18,577) to stabilize; failure may test lower supports. Caution prevails given technical resistance and pattern signals.
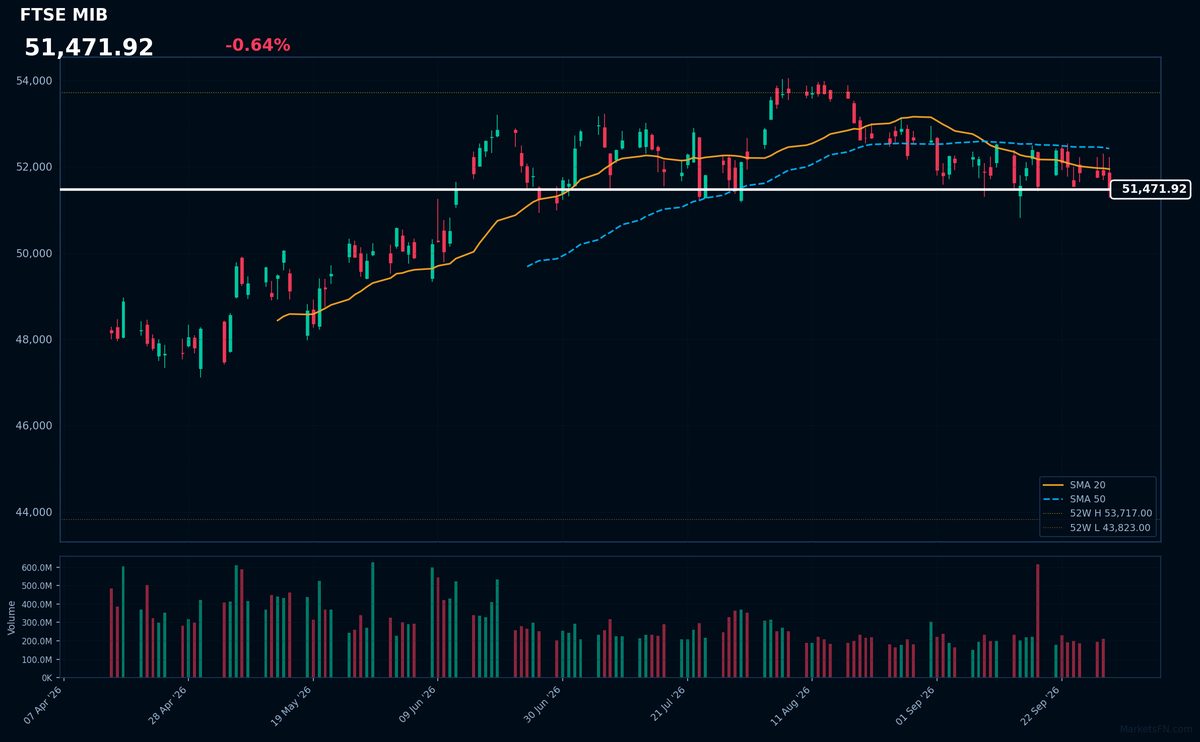
FTSEMIB
FTSE MIB
50,061
▲0.63%
RSI 34

Double Top — Bearish 65%Double Bottom — Bullish 65%Trendlines — Neutral 65%
20d: Sup descending 48,909 (-2.3%) Res descending 51,482 (+2.8%)
50d: Sup descending 48,943 (-2.2%) Res descending 51,766 (+3.4%)
S/R Levels
| R1 | 54,042 | +8.0% | ★★★★★ |
| R2 | 52,925 | +5.7% | ★★★★☆ |
| R3 | 50,454 | +0.8% | ★★★☆☆ |
|
50,061
52W 41,360–54,042
|
| S1 | 41,669 | -16.8% | ★★★★★ |
| S2 | 42,862 | -14.4% | ★★★★☆ |
| S3 | 45,246 | -9.6% | ★★★☆☆ |
Moving Averages
| SMA 20 | 51,207 | below -2.2% |
| SMA 50 | 52,147 | below -4.0% |
| SMA 200 | 49,125 | above +1.9% |
Price below SMA20 & SMA50 — bearish structure
Price above SMA200 (+1.9%) — long-term uptrend
Analysis
The FTSE MIB trades at 50,061, up 0.63%, with the RSI-14 at 34 indicating oversold conditions. The index remains below key SMAs (20d at 51,207, 50d at 52,147), though above the 200d SMA (49,125), reflecting near-term bearish pressure within a broader uptrend. Resistance levels are noted at 50,454, 52,925, and 54,042, while supports lie at 45,246, 42,862, and 41,669. Three double-top patterns (65% confidence each) reinforce bearish sentiment. Descending trendlines show immediate resistance at 51,482 (20d) and 51,766 (50d), with supports at 48,909 and 48,943 respectively. A break below 200d SMA could accelerate declines, while reclaiming 20d SMA may signal recovery.
AEX
AEX Amsterdam
1,134.94
▲0.35%
RSI 49

Double Top — Bearish 65%Double Bottom — Bullish 65%Trendlines — Neutral 65%
20d: Sup ascending 1,101.45 (-3.0%) Res ascending 1,143.70 (+0.8%)
50d: Sup descending 1,083.76 (-4.5%) Res ascending 1,137.01 (+0.2%)
S/R Levels
|
1,134.94
52W 916.79–1,136.11
|
| S1 | 944.33 | -16.8% | ★★★★★ |
| S2 | 988.23 | -12.9% | ★★★★☆ |
| S3 | 1,092.00 | -3.8% | ★★★☆☆ |
Moving Averages
| SMA 20 | 1,112.78 | above +2.0% |
| SMA 50 | 1,110.23 | above +2.2% |
| SMA 200 | 1,046.56 | above +8.4% |
Price above SMA20 & SMA50 — bullish structure
Price above SMA200 (+8.4%) — long-term uptrend
Analysis
The AEX Amsterdam trades at 1,135, up 0.35%, with the RSI-14 neutral at 49, indicating balanced momentum. The index remains above key SMAs (20d: 1,113; 50d: 1,110; 200d: 1,047), suggesting underlying bullish support. However, three consecutive bearish Double Top patterns (65% confidence) signal potential near-term resistance. Immediate support levels are at 1,092 (S3), 988 (S2), and 944 (S1). Short-term trendlines show ascending support at 1,101 (20d) and descending support at 1,084 (50d), while resistance converges near 1,137–1,144. The mixed signals—bullish SMA alignment versus bearish patterns—warrant caution, with a break above 1,144 needed to confirm upside continuation.
Disclaimer
The content on MarketsFN.com is provided for educational and informational purposes only. It does not constitute financial advice or investment recommendations. All investments involve risks and past performance does not guarantee future results. You are solely responsible for your investment decisions.