Tron Eyes Rebound as RSI Nears Oversold at $0.3227
QuoteReporter
•3 min read
Tron Eyes Rebound as RSI Nears Oversold at $0.3227
Tron (TRX/USD) | September 02, 2026 $0.3227 +0.14%
🔍 Technical Analysis
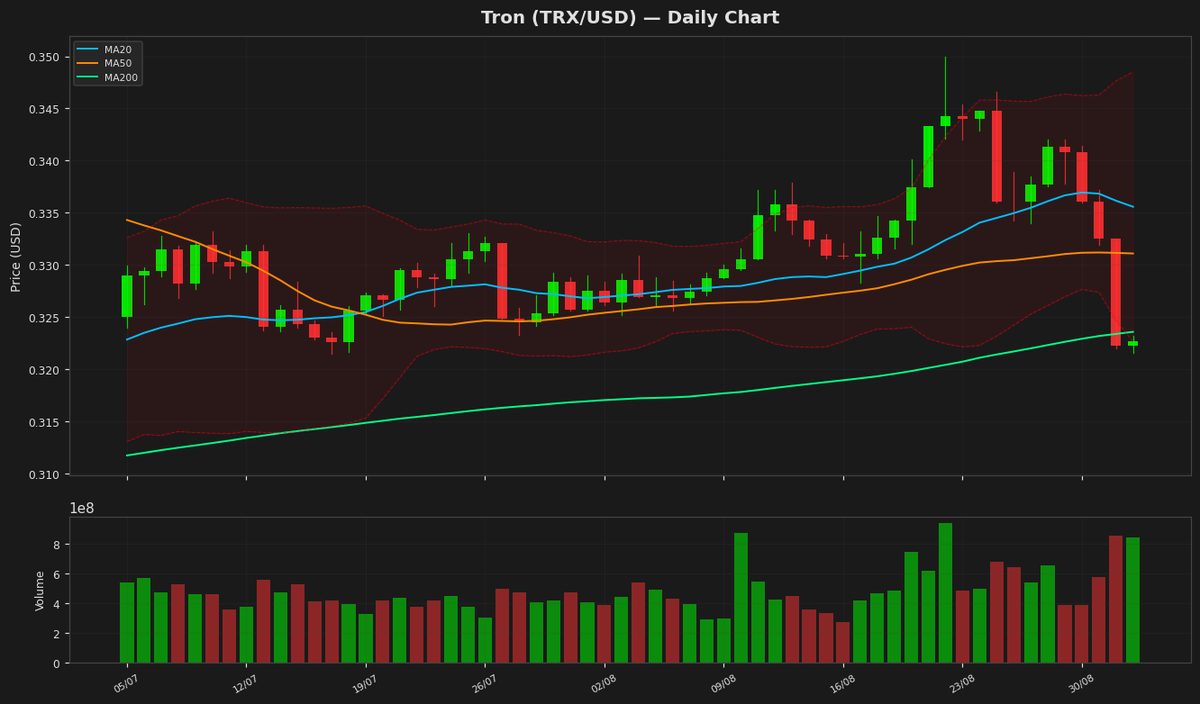
Tron (TRX) is currently trading at $0.322714, showing a minor daily gain of 0.14%. The price remains below key moving averages, with the MA20 at $0.335574 and the MA50 at $0.331091, indicating short-term bearish pressure. The MA200 at $0.323578 is nearly aligned with the current price, suggesting a potential inflection point. Bollinger Bands show a narrowing range, with the upper band at $0.348531 and the lower band at $0.322618, reflecting reduced volatility. The price hovering near the lower band hints at possible oversold conditions. The RSI(14) at 37.099858 further supports this, nearing the oversold threshold of 30 but not yet signaling a reversal. The MACD histogram is negative at -0.000503, with the signal line at 0.001647, indicating bearish momentum but with weakening divergence. Key support lies at the yearly low of $0.26813799, while resistance is seen at the 52-week high of $0.37633201. The ATR(14) of 0.005617 suggests moderate price volatility. For a bullish reversal, TRX needs to reclaim the MA20 and MA50 levels, whereas a break below $0.322618 could test the yearly low. The current technical setup suggests caution, with potential for consolidation or further downside unless bullish momentum strengthens.
Technical Metrics
| Metric | Value |
|---|---|
| Current Price | $0.3227 |
| Daily Change | +0.14% |
| MA 20 | $0.3356 |
| % from MA20 | -3.83% |
| MA 50 | $0.3311 |
| % from MA50 | -2.53% |
| MA 200 | $0.3236 |
| % from MA200 | -0.27% |
| BB Upper | $0.3485 |
| % from BB Upper | -7.41% |
| BB Lower | $0.3226 |
| % from BB Lower | +0.03% |
| RSI (14) | 37.10 |
| MACD | -0.000503 |
| MACD Signal | 0.001647 |
| ATR (14) | 0.005617 |
| 3-Day High | $0.3372 |
| 3-Day Low | $0.3216 |
| 52-Week High | $0.3763 |
| % from 52W High | -14.25% |
| 52-Week Low | $0.2681 |
| % from 52W Low | +20.35% |
| YTD High | $0.3763 |
| % from YTD High | -14.25% |
| YTD Low | $0.2681 |
| % from YTD Low | +20.35% |
📊 Market Commentary
Tron (TRX) is trading at $0.3227, showing modest gains of 0.14% today amid mixed market sentiment. The Relative Strength Index (RSI) stands at 37.1, indicating TRX is nearing oversold territory but not yet at levels that typically signal a strong reversal. Over the past 52 weeks, TRX has fluctuated between $0.2681 and $0.3763, with the current price sitting closer to the mid-range. Traders are closely monitoring whether TRX can hold above the psychological support level of $0.30, which has acted as a key floor in recent months. A break below this level could see further downside toward the yearly low, while sustained buying pressure may push TRX toward the upper half of its annual range.
Market sentiment around TRX remains cautious, reflecting broader uncertainty in the crypto market. The network’s high throughput and low transaction costs continue to support its utility, but traders are weighing these fundamentals against macroeconomic factors influencing risk assets. Volume has been relatively subdued, suggesting a lack of strong conviction in either direction. Key resistance levels to watch include $0.34 and $0.36, which have previously capped upward moves. Given the neutral RSI, TRX may consolidate in the near term unless a catalyst drives momentum. Traders are also keeping an eye on Bitcoin’s price action, as its movements often influence altcoins like TRX. For now, the focus remains on whether TRX can stabilize above $0.30 and regain bullish momentum.
Market sentiment around TRX remains cautious, reflecting broader uncertainty in the crypto market. The network’s high throughput and low transaction costs continue to support its utility, but traders are weighing these fundamentals against macroeconomic factors influencing risk assets. Volume has been relatively subdued, suggesting a lack of strong conviction in either direction. Key resistance levels to watch include $0.34 and $0.36, which have previously capped upward moves. Given the neutral RSI, TRX may consolidate in the near term unless a catalyst drives momentum. Traders are also keeping an eye on Bitcoin’s price action, as its movements often influence altcoins like TRX. For now, the focus remains on whether TRX can stabilize above $0.30 and regain bullish momentum.
Disclaimer
The content on MarketsFN.com is provided for educational and informational purposes only. It does not constitute financial advice or investment recommendations. All investments involve risk. Cryptocurrency markets are highly volatile. Past performance does not guarantee future results.