Dogecoin Eyes Rebound as RSI Hits Oversold at $0.0821
QuoteReporter
•3 min read
Dogecoin (DOGE/USD) | October 16, 2026 $0.0821 +1.31%
🔍 Technical Analysis
**Dogecoin (DOGE) Technical Analysis**
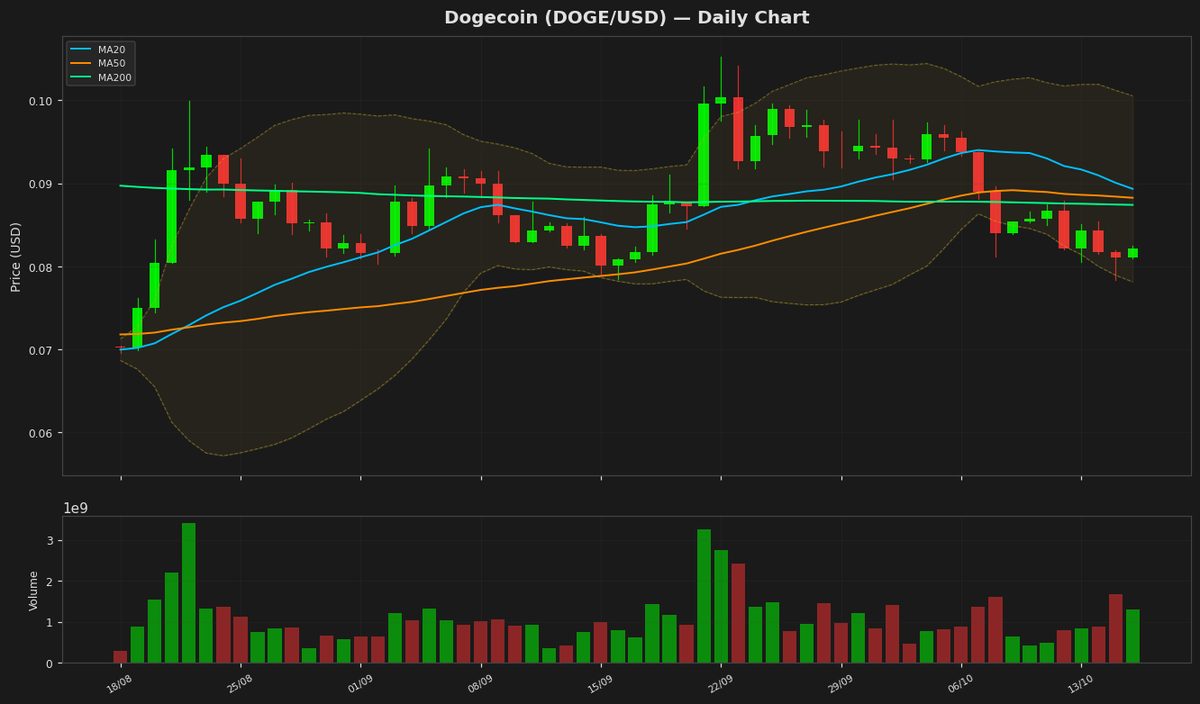
Dogecoin is currently trading at $0.08213, showing a modest daily gain of 1.31%. The price remains below key moving averages, with the 20-day MA at $0.0893, the 50-day MA at $0.0882, and the 200-day MA at $0.0874, indicating a bearish trend in the short to medium term. Bollinger Bands reveal tightening volatility, with the upper band at $0.1005 and the lower band at $0.0781. The price is hovering near the lower band, suggesting potential oversold conditions.
The RSI(14) stands at 31.08, nearing the oversold threshold of 30, which could signal a possible reversal if buying pressure increases. The MACD remains negative at -0.002177, below the signal line (-0.000881), reinforcing bearish momentum. However, the narrowing gap between the MACD and signal line hints at weakening downward momentum.
Key support lies at the 52-week low of $0.06797, while resistance is seen at the 20-day MA ($0.0893) and the upper Bollinger Band ($0.1005). ATR(14) at 0.003618 suggests relatively low volatility. If DOGE holds above $0.0781 (lower Bollinger Band), a rebound toward $0.0893 is plausible. Failure to sustain this level may lead to a retest of $0.06797. Traders should monitor RSI and MACD for potential trend reversals.
Dogecoin is currently trading at $0.08213, showing a modest daily gain of 1.31%. The price remains below key moving averages, with the 20-day MA at $0.0893, the 50-day MA at $0.0882, and the 200-day MA at $0.0874, indicating a bearish trend in the short to medium term. Bollinger Bands reveal tightening volatility, with the upper band at $0.1005 and the lower band at $0.0781. The price is hovering near the lower band, suggesting potential oversold conditions.
The RSI(14) stands at 31.08, nearing the oversold threshold of 30, which could signal a possible reversal if buying pressure increases. The MACD remains negative at -0.002177, below the signal line (-0.000881), reinforcing bearish momentum. However, the narrowing gap between the MACD and signal line hints at weakening downward momentum.
Key support lies at the 52-week low of $0.06797, while resistance is seen at the 20-day MA ($0.0893) and the upper Bollinger Band ($0.1005). ATR(14) at 0.003618 suggests relatively low volatility. If DOGE holds above $0.0781 (lower Bollinger Band), a rebound toward $0.0893 is plausible. Failure to sustain this level may lead to a retest of $0.06797. Traders should monitor RSI and MACD for potential trend reversals.
Technical Metrics
| Metric | Value |
|---|---|
| Current Price | $0.0821 |
| Daily Change | +1.31% |
| MA 20 | $0.0893 |
| % from MA20 | -8.06% |
| MA 50 | $0.0882 |
| % from MA50 | -6.93% |
| MA 200 | $0.0874 |
| % from MA200 | -6.02% |
| BB Upper | $0.1005 |
| % from BB Upper | -18.30% |
| BB Lower | $0.0781 |
| % from BB Lower | +5.13% |
| RSI (14) | 31.08 |
| MACD | -0.002177 |
| MACD Signal | -0.000881 |
| ATR (14) | 0.003618 |
| 3-Day High | $0.0854 |
| 3-Day Low | $0.0784 |
| 52-Week High | $0.1183 |
| % from 52W High | -30.55% |
| 52-Week Low | $0.0680 |
| % from 52W Low | +20.83% |
| YTD High | $0.1561 |
| % from YTD High | -47.38% |
| YTD Low | $0.0680 |
| % from YTD Low | +20.83% |
📊 Market Commentary
Dogecoin (DOGE) is trading at $0.0821, up 1.31% today, as the meme coin shows modest recovery after recent declines. The Relative Strength Index (RSI) at 31.1 suggests DOGE is nearing oversold territory, which could attract short-term buyers looking for a rebound. However, market sentiment remains cautious, with traders weighing broader crypto market trends and Dogecoin’s historical volatility.
Key support sits at the 52-week low of $0.0680, a critical level that has held since October 2023. A break below this could signal further downside. On the upside, resistance is seen near the $0.09–$0.10 zone, where DOGE has faced rejections multiple times in recent months. The 52-week high of $0.1183 remains a distant but notable reference point for long-term holders.
Traders are monitoring Bitcoin’s price action, as DOGE often moves in tandem with the broader market. Additionally, network activity and social media engagement—key drivers for meme coins—are being watched for signs of renewed retail interest. Whale activity and exchange flows also remain in focus, as large holders can significantly impact DOGE’s liquidity and price stability.
While the oversold RSI hints at potential near-term consolidation or a bounce, Dogecoin’s lack of fundamental catalysts keeps the market hesitant. For now, traders are likely to remain reactive to broader crypto trends rather than betting on independent DOGE momentum.
Key support sits at the 52-week low of $0.0680, a critical level that has held since October 2023. A break below this could signal further downside. On the upside, resistance is seen near the $0.09–$0.10 zone, where DOGE has faced rejections multiple times in recent months. The 52-week high of $0.1183 remains a distant but notable reference point for long-term holders.
Traders are monitoring Bitcoin’s price action, as DOGE often moves in tandem with the broader market. Additionally, network activity and social media engagement—key drivers for meme coins—are being watched for signs of renewed retail interest. Whale activity and exchange flows also remain in focus, as large holders can significantly impact DOGE’s liquidity and price stability.
While the oversold RSI hints at potential near-term consolidation or a bounce, Dogecoin’s lack of fundamental catalysts keeps the market hesitant. For now, traders are likely to remain reactive to broader crypto trends rather than betting on independent DOGE momentum.
Disclaimer
The content on MarketsFN.com is provided for educational and informational purposes only. It does not constitute financial advice or investment recommendations. All investments involve risk. Cryptocurrency markets are highly volatile. Past performance does not guarantee future results.