10-Year Yield Nears 52-Week High as Curve Steepens to 47 bps
MarketsFN Data Team
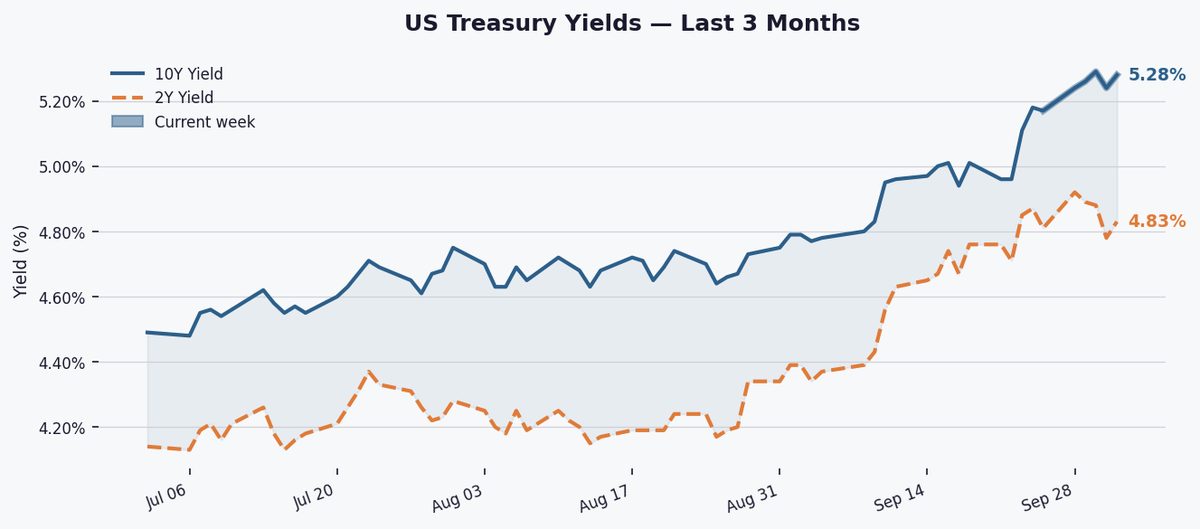
The 10-year Treasury yield rose 4 bps to 5.28% on Tuesday, extending its weekly climb to 11 bps as the 2Y-10Y spread widened to 47 bps, signaling persistent growth expectations despite Fed tightening.
The 10-year yield has surged 109 bps year-to-date, now hovering just 1 bp below its 52-week high of 5.29%. At 5.28%, it remains 50.5 bps above its 3-month average and 89.9 bps higher than the 1-year average, reflecting a sustained upward shift in rate expectations since late 2025.
The 2Y-10Y spread expanded 15 bps this week to 47 bps, remaining positively sloped and well above its 52-week low of 20 bps. Historically, such steepening suggests markets anticipate either prolonged economic expansion or inflationary pressures outweighing Fed rate hikes in the medium term.

Traders await Friday's jobs report for September, with consensus at +180K jobs. Strong data could push 10Y toward 5.30%, while a miss may trigger profit-taking. Fed speakers this week will be scrutinized for hints on November rate decisions.
Key Statistics at a Glance
| Edition | Mid-Week Update |
| Date | Tuesday, October 06, 2026 |
| 10Y Yield | 5.28% |
| 10Y Day-on-day | ▲ 4.0 bps |
| 10Y Week-on-week | ▲ 11.0 bps |
| 10Y YTD change | +109.0 bps |
| 10Y 3-month avg | 4.77% |
| 10Y 1-year avg | 4.38% |
| 10Y 52-week high | 5.29% |
| 10Y 52-week low | 3.97% |
| 2Y Yield | 4.83% |
| 2Y–10Y Spread | +0.470% (+47.0 bps) |
| Spread WoW | ▲ 15.0 bps |
| Spread 52-week high | +0.740% |
| Spread 52-week low | +0.200% |
| Curve signal | Positive |