Inflation Steady: 10Y Breakeven Holds at 2.36%
MarketsFN Data Team
What is a breakeven rate?
The breakeven inflation rate equals the yield gap between a conventional Treasury and a TIPS of the same maturity. If the 10Y nominal yields 4.50% and the 10Y TIPS yields 2.00%, the 10Y breakeven is 2.50% — the level of average CPI at which an investor is indifferent between the two bonds. A higher breakeven signals stronger market inflation expectations.
Why three horizons?
The 5Y breakeven is most sensitive to near-term CPI prints and Fed policy. The 10Y breakeven blends short and long-run expectations. The 5Y/5Y forward looks only at years 5–10, stripping out near-term noise — it is the purest read on whether long-run inflation is anchored. The Fed watches the forward rate most closely.
The Fed's 2% target in breakeven terms
The Federal Reserve targets 2% PCE inflation, not CPI. Because CPI runs roughly 0.3–0.5 pp above PCE (different basket weights and housing costs), breakevens in the 2.2–2.5% range are broadly consistent with the Fed achieving its mandate. Breakevens above 2.5% signal markets doubting that 2% will be delivered; below 2.0% signals deflation or stagnation risk.
Real yields and monetary conditions
The 10Y TIPS yield is the "real" risk-free rate — what investors earn above and beyond inflation. Positive real yields make saving more attractive than spending or risk-taking: a tightening drag on the economy. Negative real yields (common in 2020–2022) were highly stimulative, driving asset prices and compressing credit spreads. The real yield is a direct gauge of monetary restriction.
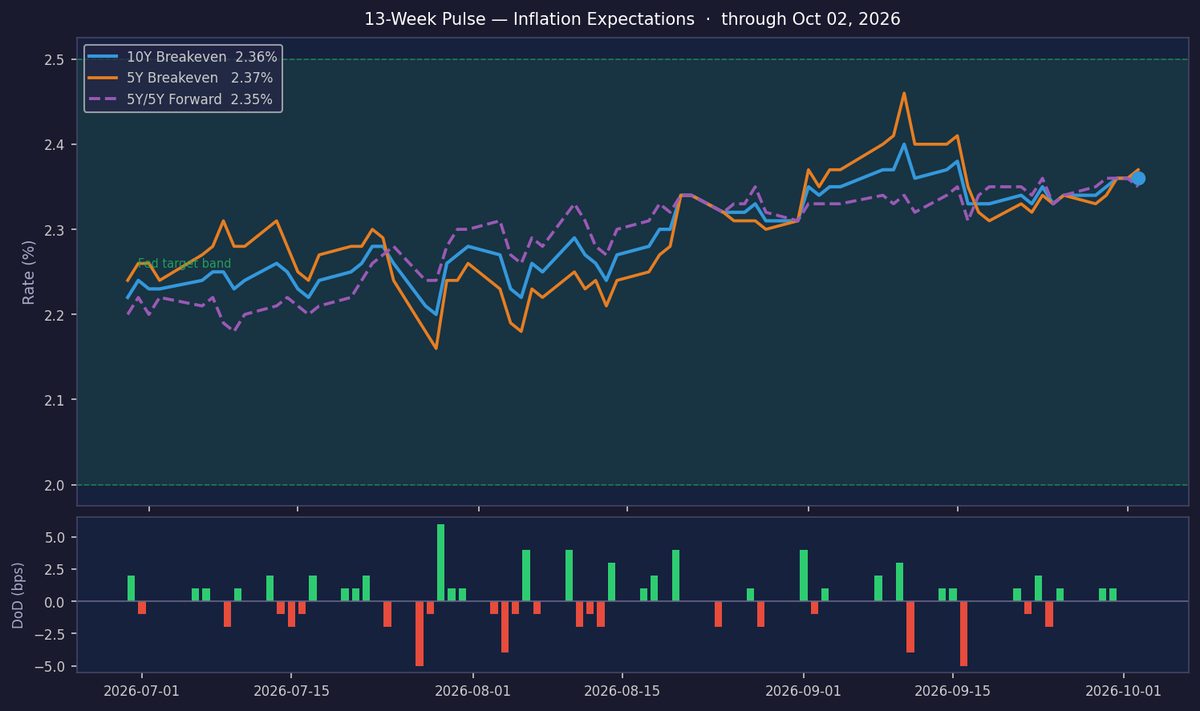
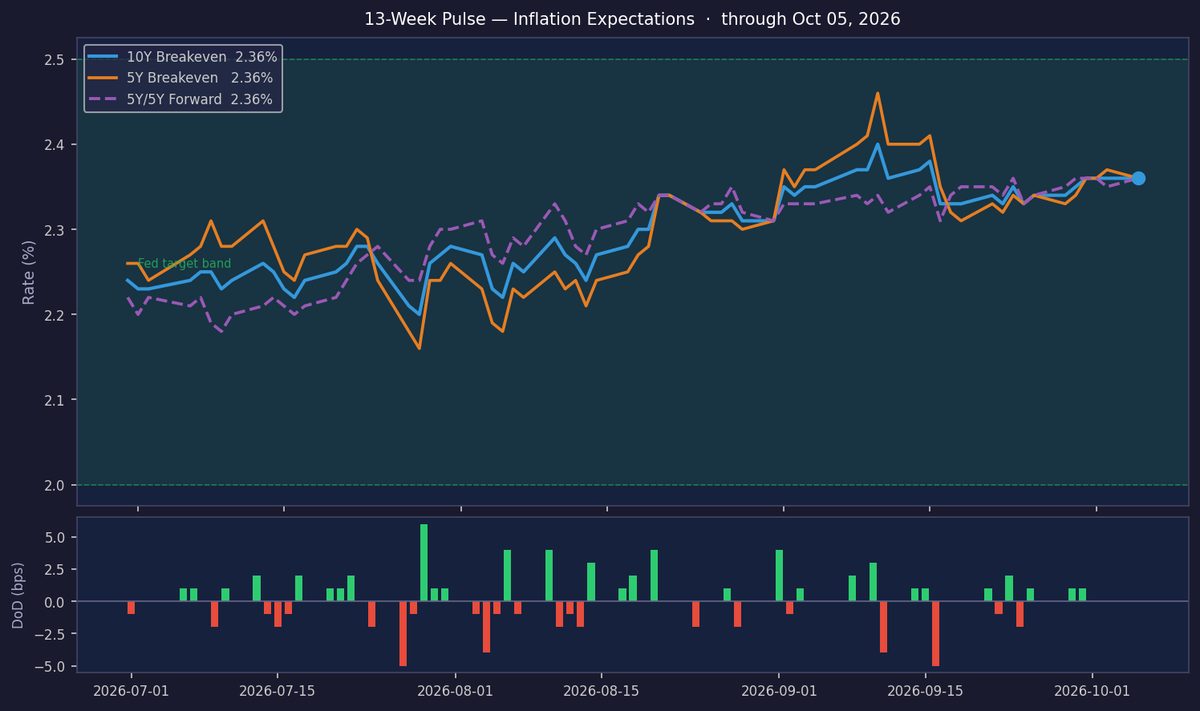
Inflation expectations remain firmly anchored, with the 10Y breakeven holding at 2.36% amid an ON TARGET regime. Today’s flat daily move reflects muted market reactions to recent data, though the 3-month average continues to trend slightly higher. The 78th percentile ranking suggests expectations are elevated but within a stable range relative to the past decade.
The 5Y/5Y forward breakeven at 2.36% aligns precisely with the 10Y, signaling no near-term inflation divergence. This Fed-favored metric remains comfortably within range, though its 91st percentile ranking warrants vigilance for upward drift. The flat term premium (+0.0 bps) further underscores a balanced outlook between near-term and structural pressures.

The 10Y real yield of 2.92% reflects persistently restrictive monetary conditions, with nominal yields at 6.23% underscoring the Fed’s tight stance. The 340 bps gap between nominal and real yields highlights entrenched inflation risk premiums, but real yields at these levels continue to weigh on growth-sensitive assets.
A regime shift from ON TARGET would likely require either a sustained move in 5Y/5Y breakevens above 2.50% or a breakdown in the term structure. With the term premium flat, watch for upcoming labor data or Fed rhetoric to disrupt the current equilibrium. For now, the outlook remains stable but sensitive to incremental data surprises.
| Series | Latest | DoD | WoW | 10Y Rank | Freq. |
|---|---|---|---|---|---|
| 10Y Breakeven (T10YIE) | 2.36% | +0.0 bps | +2.0 bps | 78.0th pct | Daily |
| 5Y Breakeven (T5YIE) | 2.36% | -1.0 bps | +3.0 bps | 66.5th pct | Daily |
| 5Y/5Y Forward (T5YIFR) | 2.36% | +1.0 bps | — | 91.4th pct | Daily |
| 10Y Real / TIPS (DFII10) | 2.92% | +4.0 bps | — | — | Daily |
| 10Y Nominal (DGS10) | 6.23% | +0.0 bps | +24.0 bps | — | Daily |
| Term Premium (10Y−5Y be) | +0.0 bps | n/a | — | — | Derived |
| CPI YoY | 3.7% YoY (August 2026) | n/a | — | — | Monthly |
| Core PCE YoY | 3.0% YoY (August 2026) | n/a | — | — | Monthly |