Stocks Retreat as Dow Drops 370 Points Amid Iran Tensions; Oil Surges 3%
MarketsFN Team
Stocks Retreat as Dow Drops 370 Points Amid Iran Tensions; Oil Surges 3%
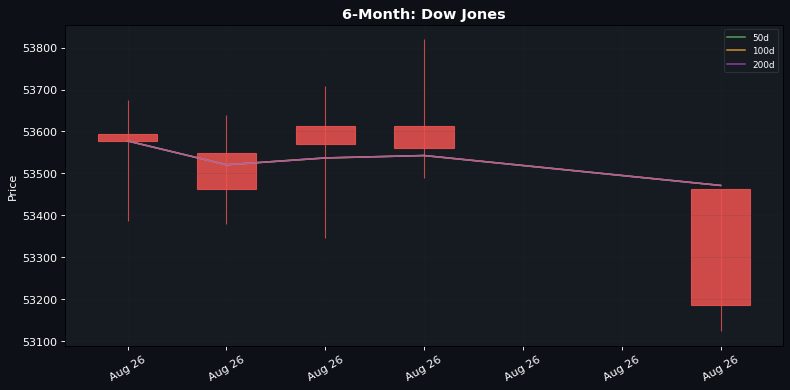
U.S. equities closed mixed on Monday as geopolitical tensions and a surprise contraction in Chicago PMI weighed on sentiment. The Dow Jones led losses with a 0.70% decline, while WTI crude surged 3.05% after U.S. strikes on Iran raised supply concerns.
🇺🇸 US Session Overview
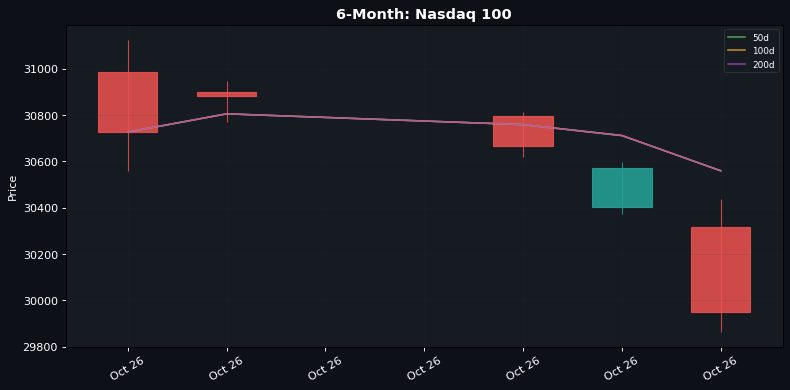
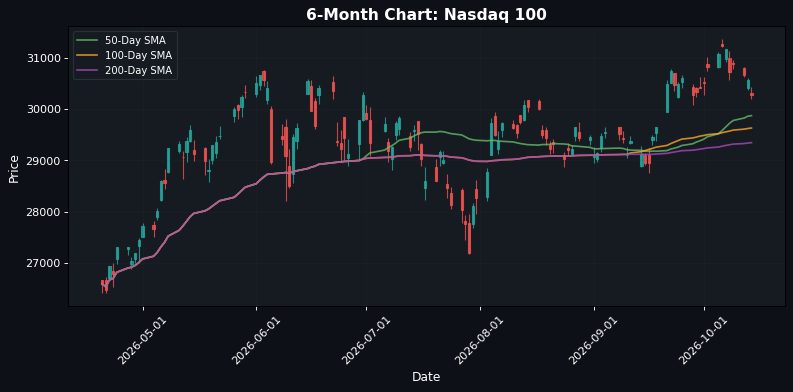
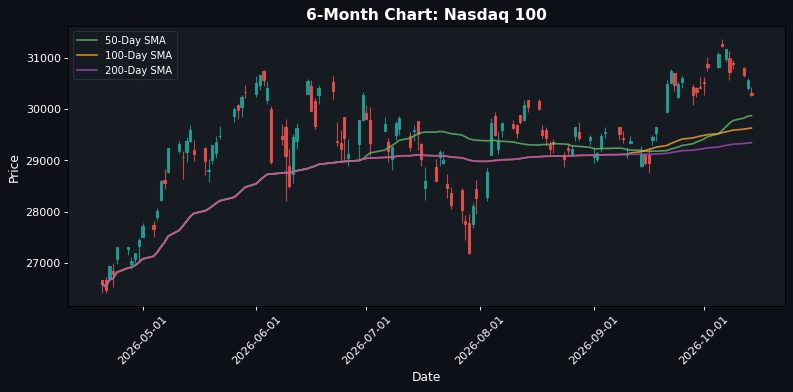
The S&P 500 slipped 0.33% to 7,686.14, dragged down by energy and financials, while the Nasdaq 100 eked out a 0.08% gain to 29,456.97 as tech outperformed. The Dow's 370-point drop reflected broad risk-off sentiment after headlines about U.S. military action against Iran. Small caps underperformed, with the Russell 2000 falling 0.54%.
Defensive sectors like utilities and consumer staples saw inflows, while industrials and materials lagged. The Chicago PMI miss (47.1 vs. 57.8 expected) exacerbated concerns about regional economic softness.
📅 Economic Calendar Highlights
Today's data painted a mixed global picture: China's manufacturing PMI edged up to 49.8 (still contractionary), while Germany's CPI cooled to 0.2% MoM. The Chicago PMI collapse into contraction territory (47.1) contrasted sharply with expectations, raising questions about Midwest factory activity.
Emerging markets showed resilience, with India's Q1 GDP matching expectations at 7.8% YoY, while Turkey's growth slowed to 2.3%. Brazil's debt-to-GDP ratio worsened to 82.5%, exceeding forecasts.
💱 FX & Commodities
The DXY gained ground as USD/CHF jumped 0.57% to 0.8084, while EUR/USD fell 0.33%. Gold rose 0.53% to $4,501.70 as haven demand returned. WTI crude's 3.05% surge to $85.94 reflected Middle East supply risks, though Brent oddly fell 1.11%. Cryptos gained, with Bitcoin up 1.12% to $79,121.51.
Looking ahead, Asian markets will digest today's Chinese PMI data while monitoring oil price volatility. Wednesday's U.S. ISM Manufacturing report looms as the next major catalyst after today's disappointing regional data.
🇺🇸 US Indices — Session Close
| Index | Price | Change | Change % |
|---|---|---|---|
| S&P 500 | 7,686.14 | ▼ -25.62 | ▼ -0.33% |
| Nasdaq 100 | 29,456.97 | ▲ +23.54 | ▲ +0.08% |
| Dow Jones | 53,185.90 | ▼ -374.09 | ▼ -0.70% |
| Russell 2000 | 2,956.45 | ▼ -15.92 | ▼ -0.54% |
💱 FX Majors
| Pair | Rate | Change % |
|---|---|---|
| EUR/USD | 1.1618 | ▼ -0.33% |
| GBP/USD | 1.3547 | ▼ -0.37% |
| USD/JPY | 159.75 | ▲ +0.27% |
| AUD/USD | 0.7167 | ▼ -0.38% |
| USD/CHF | 0.8084 | ▲ +0.57% |
🛢️ Commodities & Crypto
| Asset | Price (USD) | Change % |
|---|---|---|
| Gold (XAU/USD) | 4,501.70 | ▲ +0.53% |
| Silver (XAG/USD) | 67.31 | ▲ +0.46% |
| Crude Oil (WTI) | 85.94 | ▲ +3.05% |
| Brent Oil | 88.32 | ▼ -1.11% |
| Natural Gas | 2.93 | ▲ +1.52% |
| Bitcoin | 79,121.51 | ▲ +1.12% |
| Ethereum | 2,484.44 | ▲ +1.09% |
📋 Today's Earnings
| Ticker | Company | Timing | Market Cap |
|---|---|---|---|
| BBLRX | Bioline Rx Ltd ADR | BMO | 12240000.0 |
| CCFND | C1 Fund Inc | BMO | nan |
| LLX | LexinFintech Holdings Ltd ADR | BMO | 141870000.0 |
| PPLSM | Pulsenmore Ltd | BMO | 17030000.0 |
| SSAIC | Science Applications International Corp | BMO | 5420000000.0 |
| SSY | So-Young International Inc ADR | BMO | 246710000.0 |
| CCANG | Cango Inc | AMC | 98040000.0 |
| PPXS | Pyxis Tankers Inc | AMC | 54840000.0 |
📅 Economic Calendar
All times in UTC — Actual highlighted where available
| Time | Currency | Event | Imp. | Actual | Forecast | Previous |
|---|---|---|---|---|---|---|
| 01:30 | CNY | Manufacturing PMI (Aug) | 🔴🔴🔴 | 49.8 | 49.5 | 49.2 |
| 12:00 | EUR | German CPI (MoM) (Aug) | 🔴🔴🔴 | 0.2% | 0.3% | 0.8% |
| 13:30 | USD | Chicago PMI (Aug) | 🔴🔴🔴 | 47.1 | 57.8 | 57.6 |
| 01:30 | AUD | Company Gross Operating Profits (QoQ) (Q2) | 🟡🟡 | 1.8% | 2.0% | -1.5% |
| 01:30 | CNY | Chinese Composite PMI (Aug) | 🟡🟡 | 49.5 | 49.3 | |
| 01:30 | CNY | Non-Manufacturing PMI (Aug) | 🟡🟡 | 49.0 | 49.5 | 49.0 |
| 07:00 | TRY | GDP (YoY) (Q2) | 🟡🟡 | 2.3% | 2.9% | 2.6% |
| 10:30 | INR | GDP Quarterly (YoY) (Q1) | 🟡🟡 | 7.8% | 7.1% | 7.8% |
| 11:30 | BRL | Gross Debt-to-GDP ratio (MoM) (Jul) | 🟡🟡 | 82.5% | 82.2% | 81.9% |
| 12:00 | EUR | German CPI (YoY) (Aug) | 🟡🟡 | 2.9% | 3.0% | 2.8% |
| 23:50 | JPY | Capital Spending (YoY) (Q2) | 🟡🟡 | — | -0.2% | 0.0% |
Report published: August 31, 2026 — 22:21 CET
Disclaimer
The content on MarketsFN.com is provided for educational and informational purposes only. It does not constitute financial advice, investment recommendations, or trading guidance. All investments involve risks, and past performance does not guarantee future results. You are solely responsible for your investment decisions and should consult a qualified financial adviser before acting. MarketsFN.com and its authors are not liable for any losses arising from your use of this information.