Solana Dips Below $104 as RSI Nears Oversold Zone
QuoteReporter
•2 min read
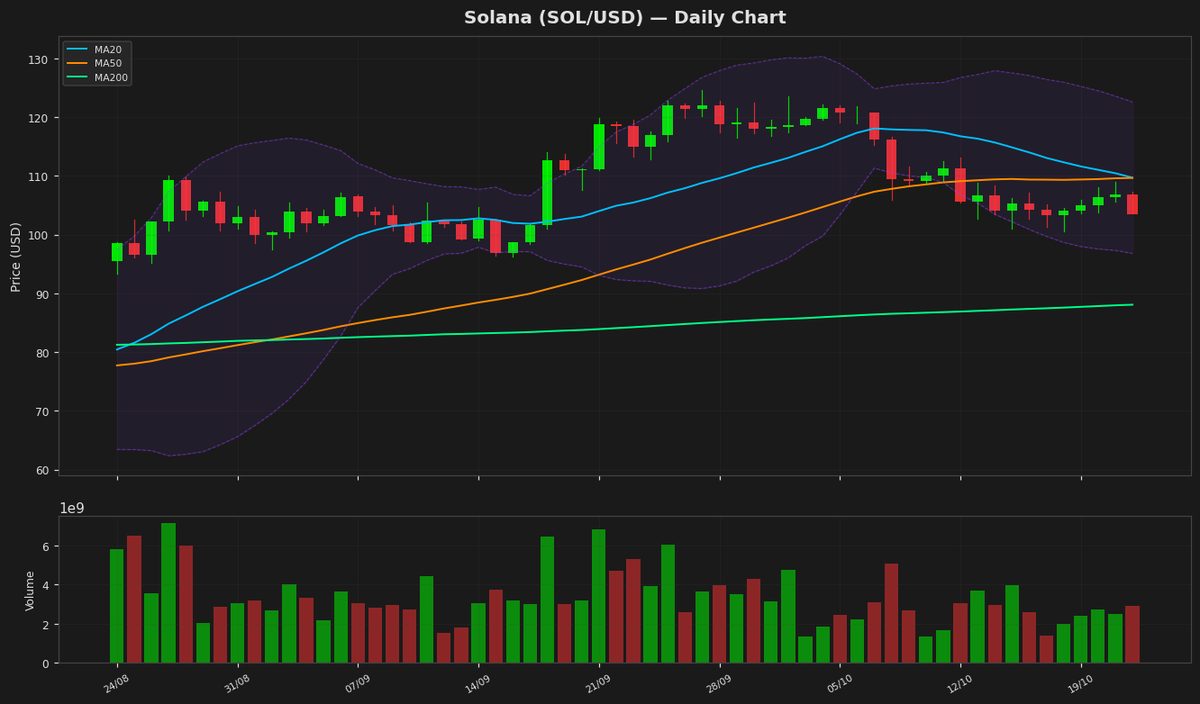
Solana (SOL/USD) | October 22, 2026 $103.5100 -3.07%
🔍 Technical Analysis
**Technical Analysis of Solana (SOL)**
Solana (SOL) is currently trading at $103.51, down 3.07% on the day, reflecting short-term bearish momentum. The price is below both the 20-day ($109.69) and 50-day ($109.65) moving averages, indicating weakening near-term sentiment, though it remains well above the 200-day MA ($88.07), suggesting a longer-term uptrend is still intact.
Bollinger Bands show the price near the lower band ($96.80), signaling potential oversold conditions, while the upper band ($122.57) marks resistance. The RSI at 36.49 is approaching oversold territory but hasn’t yet reached the 30 threshold that typically signals a reversal. The MACD histogram is negative (-2.04) and below its signal line (-1.37), reinforcing bearish momentum in the short term.
Key support lies around the $96.80 lower Bollinger Band, followed by the psychological $90 level. Resistance is seen at the 20/50-day MA confluence near $109.65–$109.69, with stronger resistance at the recent 52-week high of $124.62. A break below $96.80 could extend losses toward $88 (200-day MA), while reclaiming $109.65 may signal a recovery. The ATR (4.17) suggests moderate volatility, typical of consolidation phases.
Technical Metrics
| Metric | Value |
|---|---|
| Current Price | $103.5100 |
| Daily Change | -3.07% |
| MA 20 | $109.6885 |
| % from MA20 | -5.63% |
| MA 50 | $109.6452 |
| % from MA50 | -5.60% |
| MA 200 | $88.0722 |
| % from MA200 | +17.53% |
| BB Upper | $122.5726 |
| % from BB Upper | -15.55% |
| BB Lower | $96.8043 |
| % from BB Lower | +6.93% |
| RSI (14) | 36.49 |
| MACD | -2.041976 |
| MACD Signal | -1.371149 |
| ATR (14) | 4.167266 |
| 3-Day High | $109.0304 |
| 3-Day Low | $103.6025 |
| 52-Week High | $124.6174 |
| % from 52W High | -16.94% |
| 52-Week Low | $60.4147 |
| % from 52W Low | +71.33% |
| YTD High | $148.2160 |
| % from YTD High | -30.16% |
| YTD Low | $60.4147 |
| % from YTD Low | +71.33% |
📊 Market Commentary
Solana (SOL) is currently trading at $103.51, down 3.07% today, as the broader cryptocurrency market experiences a pullback. The Relative Strength Index (RSI) at 36.5 indicates SOL is approaching oversold territory, though it hasn’t yet reached the extreme levels typically associated with a strong reversal signal. Over the past 52 weeks, SOL has fluctuated between $60.41 and $124.61, with the current price sitting closer to the midpoint of this range.
Market sentiment appears cautious, with traders monitoring Bitcoin’s movements and macroeconomic factors influencing risk assets. SOL’s recent decline aligns with a broader cooling-off period in altcoins after earlier bullish momentum. Key support levels to watch include the psychological $100 mark, followed by the 200-day moving average near $90, which has historically acted as a strong buying zone. On the upside, resistance is seen around $110, a level that previously served as both support and resistance.
Traders are also keeping an eye on network activity, including decentralized exchange (DEX) volumes and NFT sales, as Solana’s ecosystem growth remains a critical driver of demand. Additionally, any developments regarding network upgrades or institutional interest could impact sentiment. For now, the market appears to be in a consolidation phase, with SOL’s near-term direction likely tied to broader crypto market trends.
Disclaimer
The content on MarketsFN.com is provided for educational and informational purposes only. It does not constitute financial advice or investment recommendations. All investments involve risk. Cryptocurrency markets are highly volatile. Past performance does not guarantee future results.