Solana at $96: Oversold RSI Hints at Rebound
QuoteReporter
•2 min read
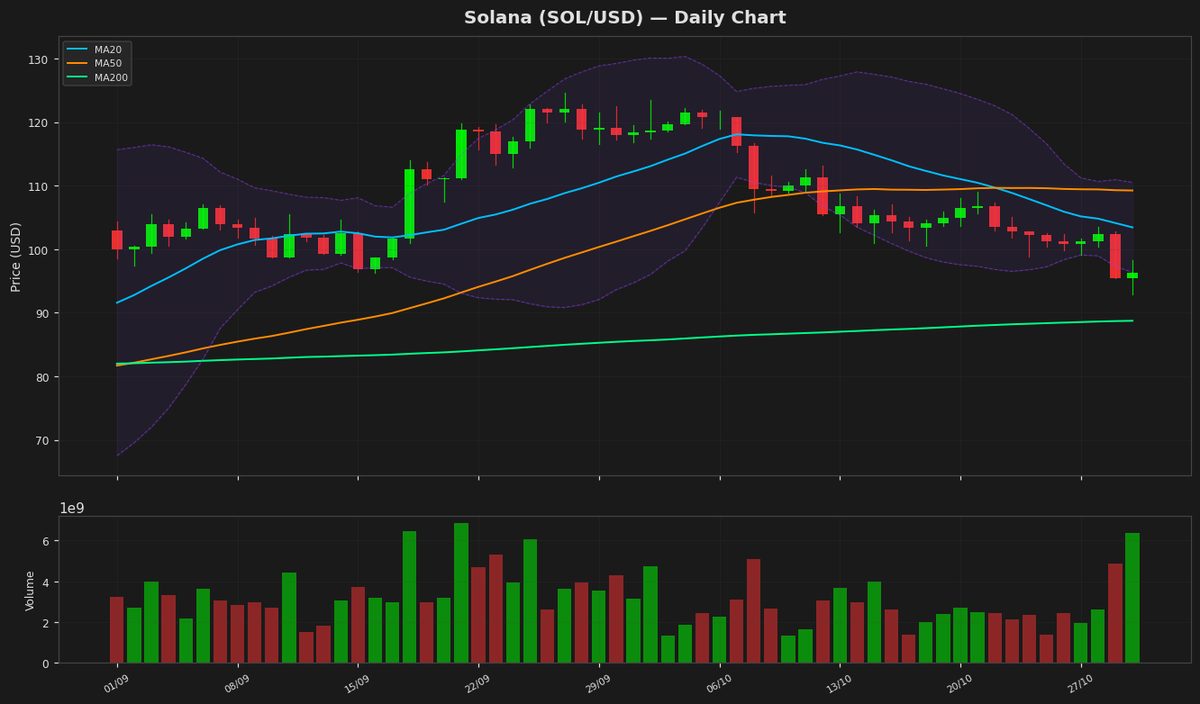
Solana (SOL/USD) | October 30, 2026 $96.2800 +0.82%
🔍 Technical Analysis
Solana (SOL) is currently trading at $96.28, showing a modest daily gain of 0.82%. The price action remains below key moving averages, with the MA20 at $103.43 and MA50 at $109.23, indicating short-term bearish pressure. However, the MA200 at $88.74 suggests long-term support remains intact. Bollinger Bands reveal a narrowing range, with the upper band at $110.51 and the lower band at $96.35, signaling reduced volatility. The price hovering near the lower band suggests potential oversold conditions. The RSI(14) at 29.61 confirms this, nearing oversold territory but not yet signaling a reversal. The MACD histogram at -3.25, below the signal line at -2.54, indicates persistent bearish momentum. Key support lies at the yearly low of $60.41, while resistance is seen at the MA20 ($103.43) and the 52-week high of $124.62. The ATR(14) at $3.75 reflects moderate volatility. SOL’s price remains in a consolidation phase, with a break above the MA20 needed to shift sentiment bullish. Until then, caution is warranted given the weak momentum indicators and resistance overhead. The $88.74 MA200 level remains a critical long-term support to watch.
Technical Metrics
| Metric | Value |
|---|---|
| Current Price | $96.2800 |
| Daily Change | +0.82% |
| MA 20 | $103.4309 |
| % from MA20 | -6.91% |
| MA 50 | $109.2321 |
| % from MA50 | -11.86% |
| MA 200 | $88.7359 |
| % from MA200 | +8.50% |
| BB Upper | $110.5090 |
| % from BB Upper | -12.88% |
| BB Lower | $96.3528 |
| % from BB Lower | -0.08% |
| RSI (14) | 29.61 |
| MACD | -3.249375 |
| MACD Signal | -2.543537 |
| ATR (14) | 3.750845 |
| 3-Day High | $103.5009 |
| 3-Day Low | $92.8596 |
| 52-Week High | $124.6174 |
| % from 52W High | -22.74% |
| 52-Week Low | $60.4147 |
| % from 52W Low | +59.37% |
| YTD High | $148.2160 |
| % from YTD High | -35.04% |
| YTD Low | $60.4147 |
| % from YTD Low | +59.37% |
📊 Market Commentary
Solana (SOL) is trading at $96.28, up 0.82% today, as the broader crypto market shows tentative signs of stabilization. The RSI at 29.6 indicates SOL is deeply oversold, suggesting potential for a short-term rebound if buying interest returns. However, market sentiment remains cautious amid lingering concerns about network congestion and competition from rival layer-1 blockchains.
SOL’s 52-week range of $60.41 to $124.61 highlights its volatility, with the current price hovering near the lower end of this band. Traders are closely watching the psychological $100 level, which could act as immediate resistance. A sustained break above this level might signal renewed confidence, while failure could see SOL retest support near $90, followed by the yearly low around $60. On-chain metrics and exchange flows are being monitored for signs of accumulation or distribution.
The broader market sentiment, particularly Bitcoin’s price action, remains a key driver for SOL. Institutional interest in Solana’s ecosystem, including developments in DeFi and NFTs, could influence mid-term price movements. For now, traders are adopting a wait-and-see approach, balancing the oversold RSI against macroeconomic uncertainties and competitive pressures in the smart contract space. Without a clear catalyst, SOL may continue to trade range-bound until broader market conditions improve.
Disclaimer
The content on MarketsFN.com is provided for educational and informational purposes only. It does not constitute financial advice or investment recommendations. All investments involve risk. Cryptocurrency markets are highly volatile. Past performance does not guarantee future results.