S&P 500 52-Week Highs & Lows Radar: Gilead Sciences, (GILD), Netflix (NFLX) and more
MarketsFN Team

Screening all 503 S&P 500 constituents for stocks nearest to their 52-week high and their 52-week low. Data as of October 26, 2026. % Realized = 52-week total return.
Legend: RSI > 70 = overbought · RSI < 30 = oversold · Green % Realized = positive 52W return · Red = negative.
📈 Nearest to 52-Week High
Sectors represented: Healthcare (2), Industrials (1), Financial (1), Energy (1)
| Ticker | Company | Sector | Price Last | % Realized | 52-Week High Date | RSI | % above MA200 | Trend |
|---|---|---|---|---|---|---|---|---|
| GILD | Gilead Sciences, Inc | Healthcare | $158.23 | +31.34% | 2026-10-26 | 61.5 | +13.8% | Above MA20, MA50, MA200 |
| CTAS | Cintas Corporation | Industrials | $225.49 | +19.51% | 2026-10-26 | 79.4 | +18.8% | Above MA20, MA50, MA200 |
| NDAQ | Nasdaq Inc | Financial | $104.22 | +17.39% | 2026-10-26 | 73.5 | +15.2% | Above MA20, MA50, MA200 |
| TRGP | Targa Resources Corp | Energy | $302.48 | +96.44% | 2026-10-26 | 61.6 | +17.7% | Above MA20, MA50, MA200 |
| IQV | IQVIA Holdings Inc | Healthcare | $280.51 | +29.01% | 2026-10-26 | 66.4 | +34.3% | Above MA20, MA50, MA200 |
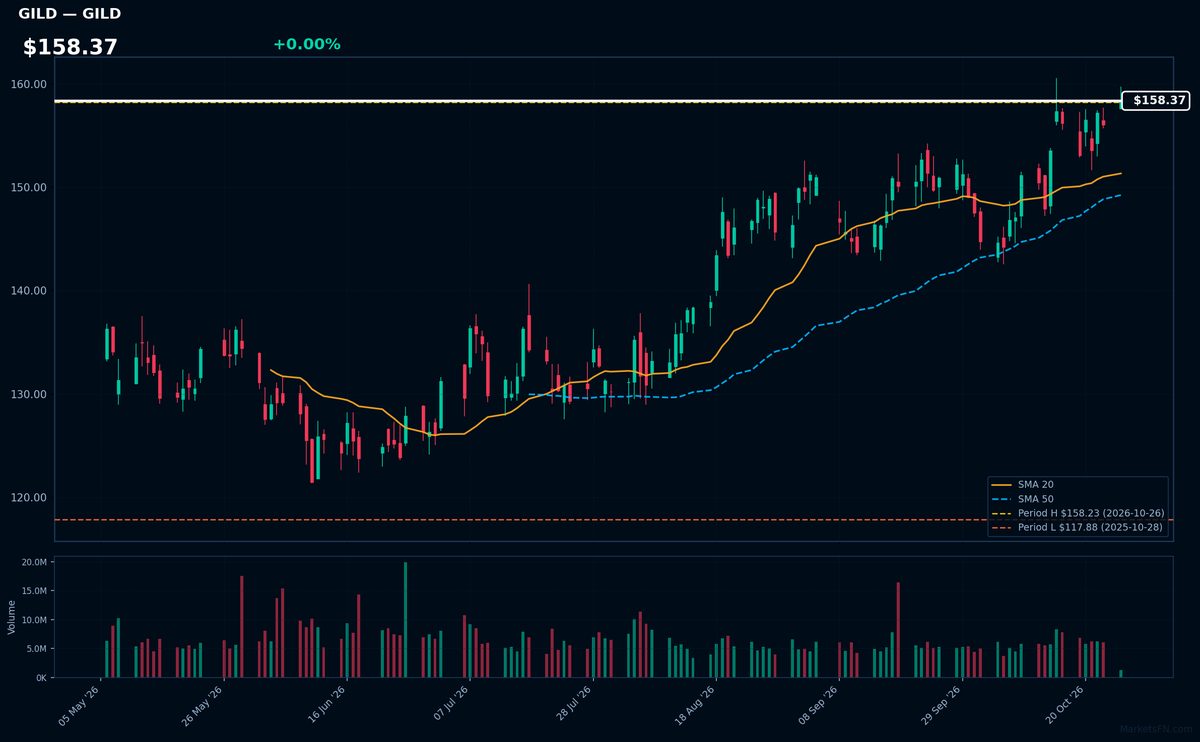
GILD | Gilead Sciences, Inc | Healthcare | Price Last: $158.23 | % Realized: +31.34% | RSI: 61.5 | % above MA200: +13.8% | Trend: Above MA20, MA50, MA200
Gilead Sciences develops antiviral therapies (notably HIV/Hepatitis C drugs) and oncology treatments. Investors care because its pipeline addresses high-margin chronic diseases, with blockbuster potential in cell therapy. Current price: $158.37.
Technically bullish: RSI(14) at 61.5 shows momentum without overbought risk, while MA alignment (price > MA20 > MA50 > MA200) confirms uptrend. Stock tests 52-week high (0.0% below), suggesting breakout potential after 31.3% annual gain.
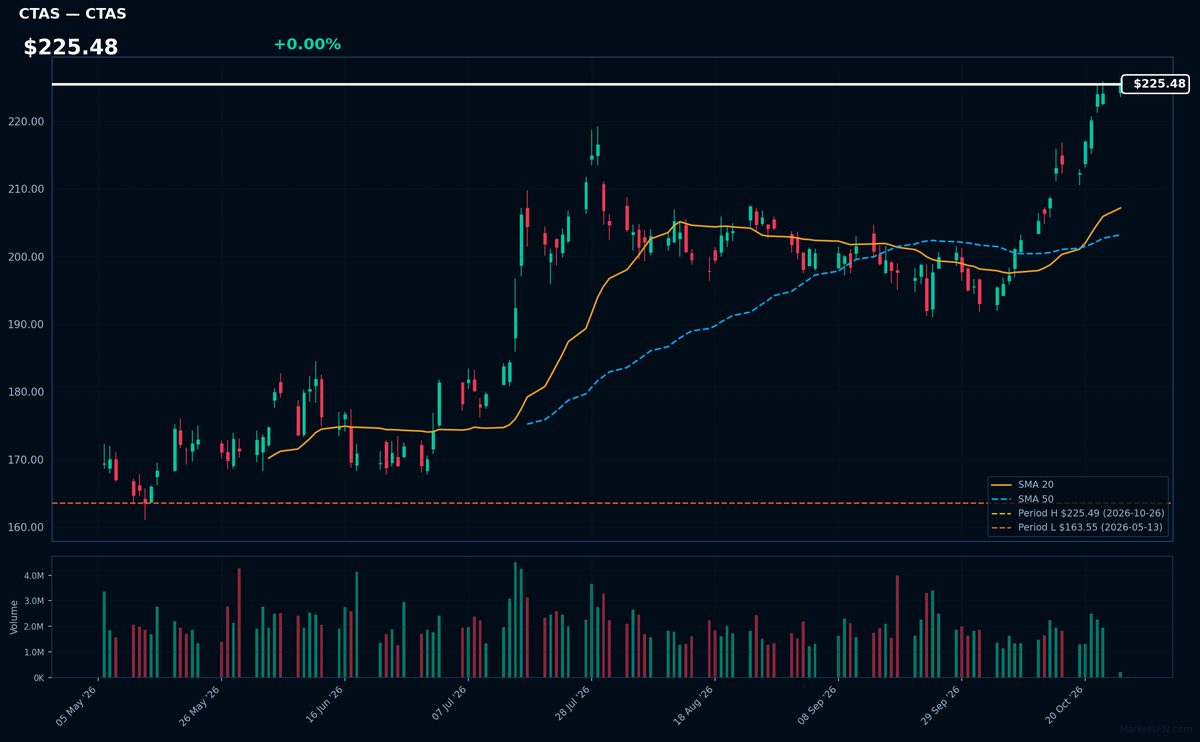
CTAS | Cintas Corporation | Industrials | Price Last: $225.49 | % Realized: +19.51% | RSI: 79.4 | % above MA200: +18.8% | Trend: Above MA20, MA50, MA200
Cintas Corporation provides specialized business services including uniform rentals, facility services, and safety supplies to over one million businesses. Investors should note its recession-resistant cash flows and dominant market position in essential corporate services.
CTAS shows strong bullish momentum with price > MA20 > MA50 > MA200 and RSI(14) at 79.4 (overbought). The stock trades at its 52-week high after a 19.5% annual return, suggesting extended upside but elevated near-term risk.
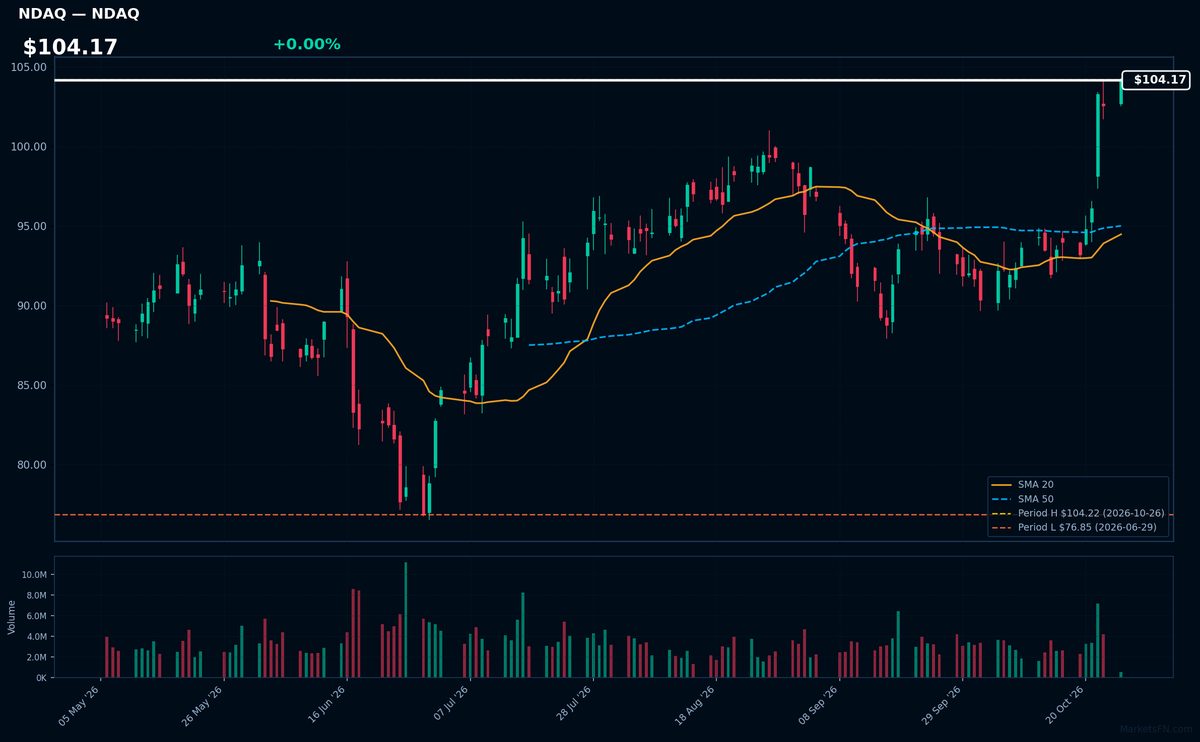
NDAQ | Nasdaq Inc | Financial | Price Last: $104.22 | % Realized: +17.39% | RSI: 73.5 | % above MA200: +15.2% | Trend: Above MA20, MA50, MA200
Nasdaq operates global exchanges (including its namesake) and provides market technology/data. Investors care because its monopoly-like exchange fees and growing SaaS-like analytics/anti-financial crime tools (35% of revenue) drive recurring revenue with high margins, insulated from trading volumes.
At $104.17 (0.0% below 52W high), NDAQ shows momentum (RSI 73.5, above MA20/50/200) but overbought signals after 17.4% YTD gain. Mixed MA alignment suggests consolidation risk.
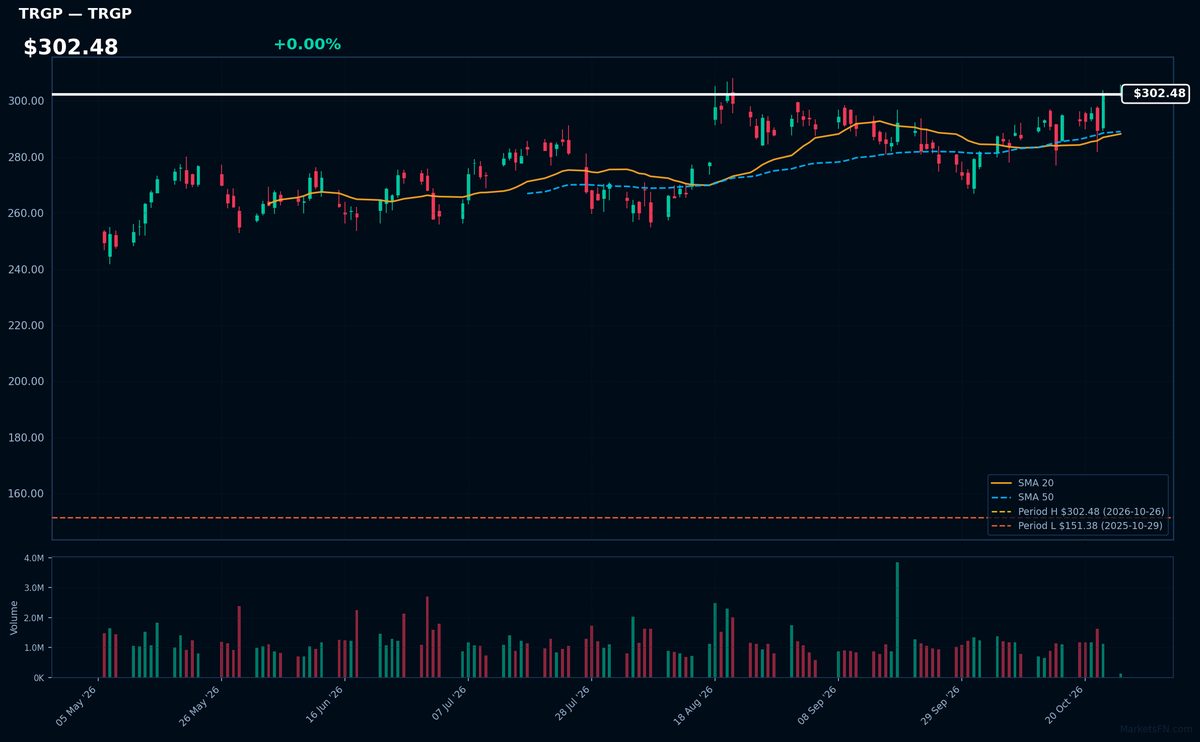
TRGP | Targa Resources Corp | Energy | Price Last: $302.48 | % Realized: +96.44% | RSI: 61.6 | % above MA200: +17.7% | Trend: Above MA20, MA50, MA200
Targa Resources operates midstream natural gas and NGL infrastructure, including processing plants and pipelines. Investors care because its fee-based contracts provide stable cash flows while benefiting from growing Permian Basin production volumes.
TRGP trades at $302.48 (0.0% below 52W high) with RSI 61.6 and above key MAs, showing strong momentum after a 96.4% 52W return. Mixed MA alignment warrants caution near resistance.
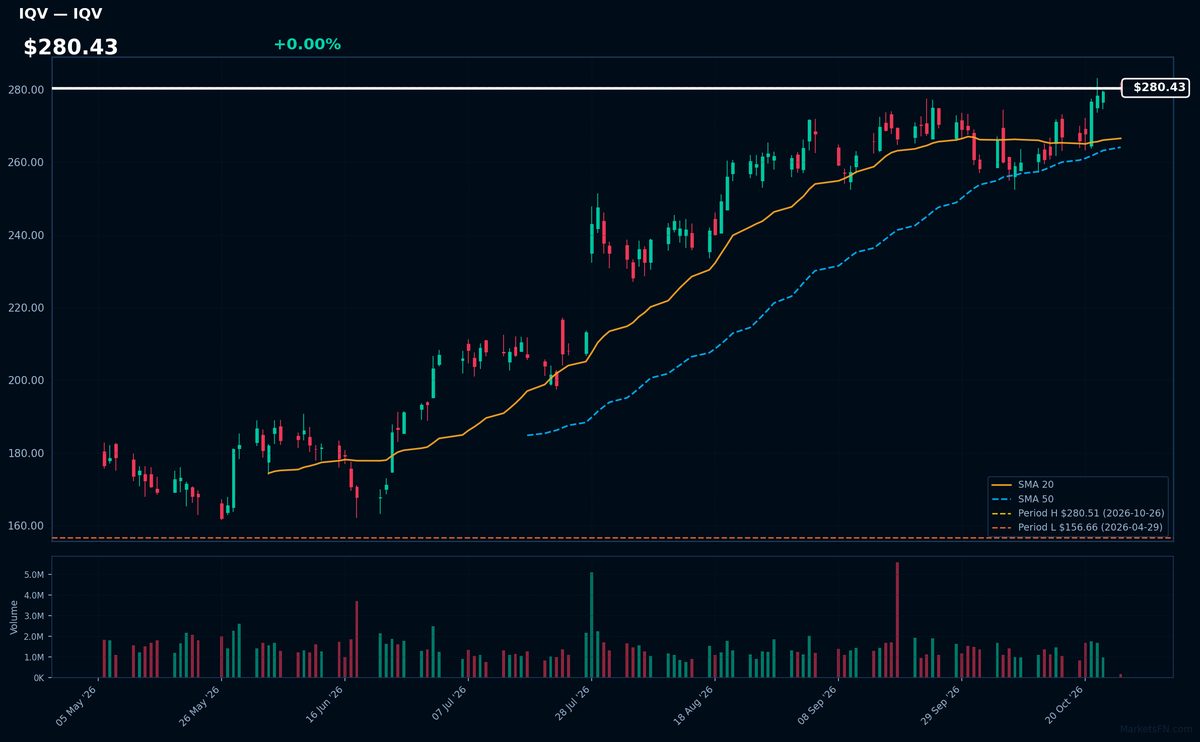
IQV | IQVIA Holdings Inc | Healthcare | Price Last: $280.51 | % Realized: +29.01% | RSI: 66.4 | % above MA200: +34.3% | Trend: Above MA20, MA50, MA200
IQVIA provides data analytics and contract research services to biopharma companies, helping streamline clinical trials and commercial strategy. Investors care because its proprietary healthcare datasets create high switching costs in a growing $150B+ market for life sciences outsourcing.
Technically bullish with RSI(14) at 66.4 and sustained uptrend (price > MA20 > MA50 > MA200). At 52-week highs after 29% annual return, momentum suggests continuation but RSI nears overbought. Extreme proximity (0.0% below high) flags potential breakout or pullback risk.
📉 Nearest to 52-Week Low
Sectors represented: Communication Services (2), Consumer Cyclical (1), Real Estate (1), Technology (1)
| Ticker | Company | Sector | Price Last | % Realized | 52-Week Low Date | RSI | % above MA200 | Trend |
|---|---|---|---|---|---|---|---|---|
| NFLX | Netflix Inc | Communication Services | $64.93 | -40.67% | 2026-10-26 | 35.2 | -21.0% | Below MA20, MA50, MA200 |
| TMUS | T-Mobile US Inc | Communication Services | $146.21 | -33.75% | 2026-10-26 | 35.3 | -22.2% | Below MA20, MA50, MA200 |
| BKNG | Booking Holdings Inc | Consumer Cyclical | $153.86 | -26.79% | 2026-10-26 | 35.9 | -13.6% | Below MA20, MA50, MA200 |
| CBRE | CBRE Group Inc | Real Estate | $122.49 | -23.98% | 2026-10-26 | 34.4 | -14.0% | Below MA20, MA50, MA200 |
| FSLR | First Solar Inc | Technology | $168.20 | -32.09% | 2026-10-26 | 36.1 | -22.6% | Below MA20, MA50, MA200 |
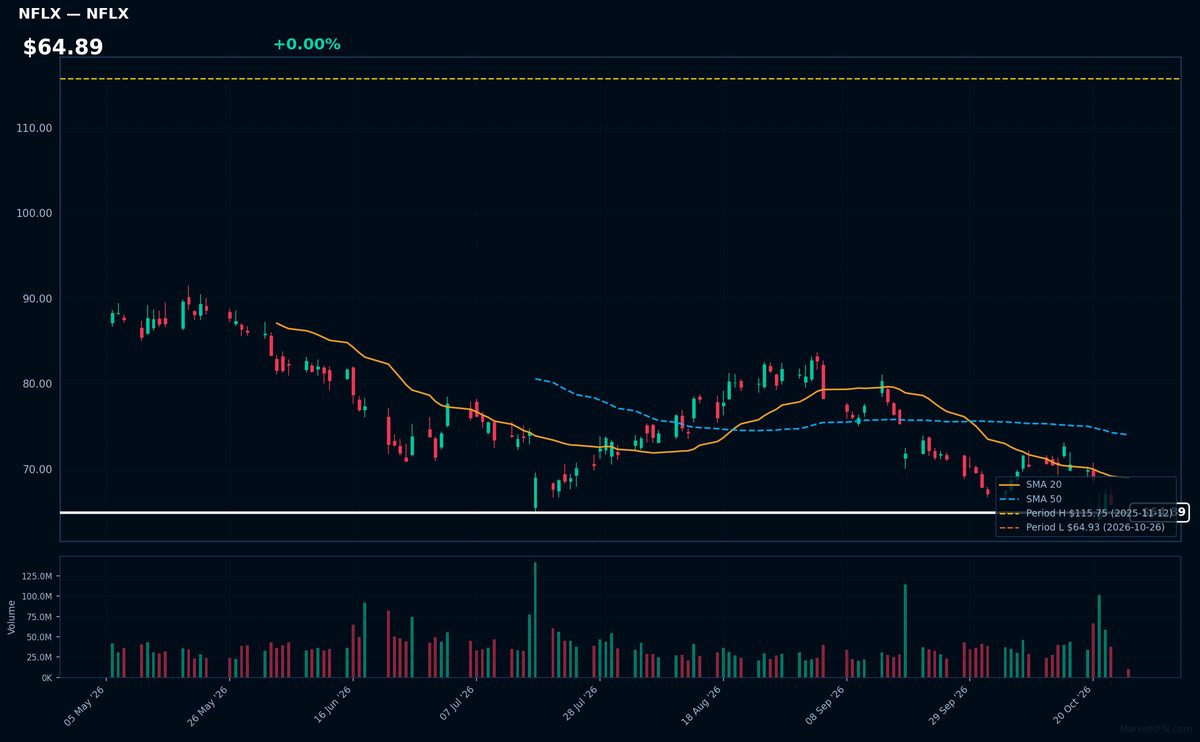
NFLX | Netflix Inc | Communication Services | Price Last: $64.93 | % Realized: -40.67% | RSI: 35.2 | % above MA200: -21.0% | Trend: Below MA20, MA50, MA200
Netflix Inc dominates global streaming with 220M+ subscribers, monetizing content through subscriptions. Investors watch its ability to fund originals while navigating streaming wars and password-sharing crackdowns—key to maintaining growth as traditional media giants compete.
Technically dire: RSI(14) at 35.2 shows near-oversold conditions, but bearish MA alignment (price < MA20 < MA50 < MA200) confirms sustained downtrend. At 0.0% above 52-week lows after a -40.7% plunge, this tests critical support—a warning sign absent fundamental catalysts.
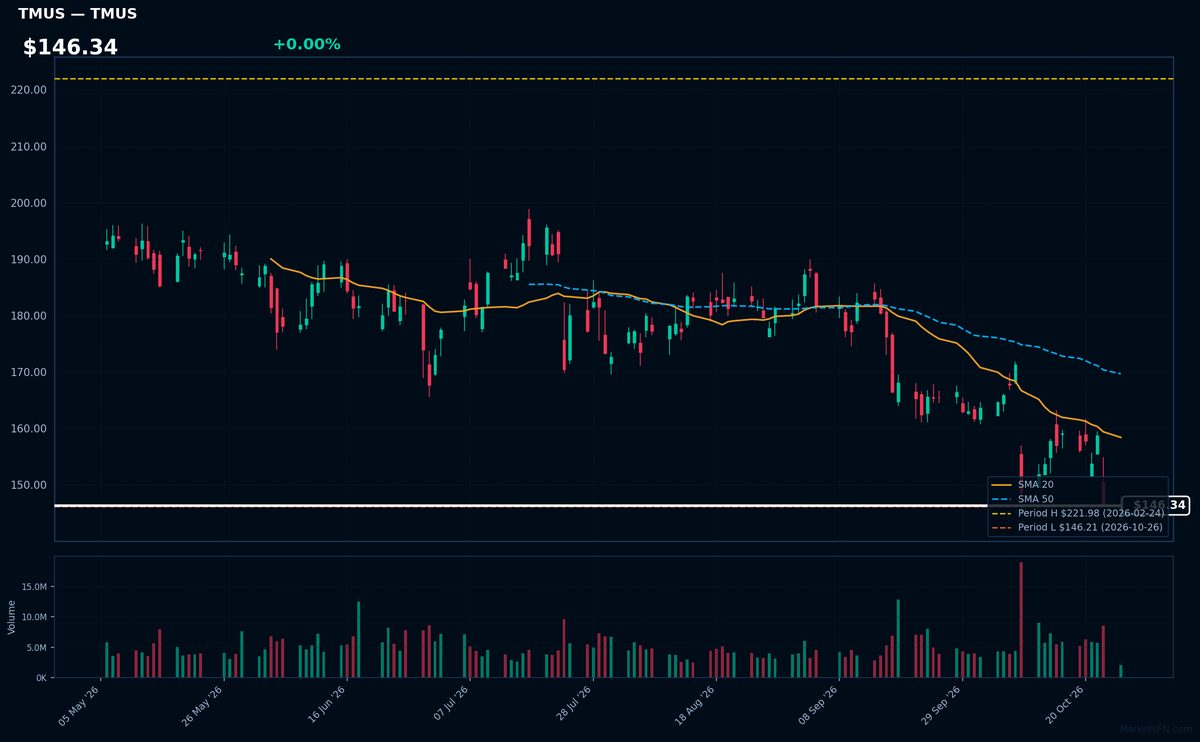
TMUS | T-Mobile US Inc | Communication Services | Price Last: $146.21 | % Realized: -33.75% | RSI: 35.3 | % above MA200: -22.2% | Trend: Below MA20, MA50, MA200
T-Mobile US Inc operates as a major wireless carrier in the U.S., known for disruptive pricing and aggressive 5G network expansion. Investors watch TMUS for its growth potential in mobile broadband and competitive pressure on industry margins.
TMUS shows severe technical weakness: RSI(14) at 35.3 (approaching oversold) with bearish MA alignment (price < MA20 < MA50 < MA200). The stock tests 52-week lows (-33.7% annual return), signaling sustained downtrend and potential breakdown risk.
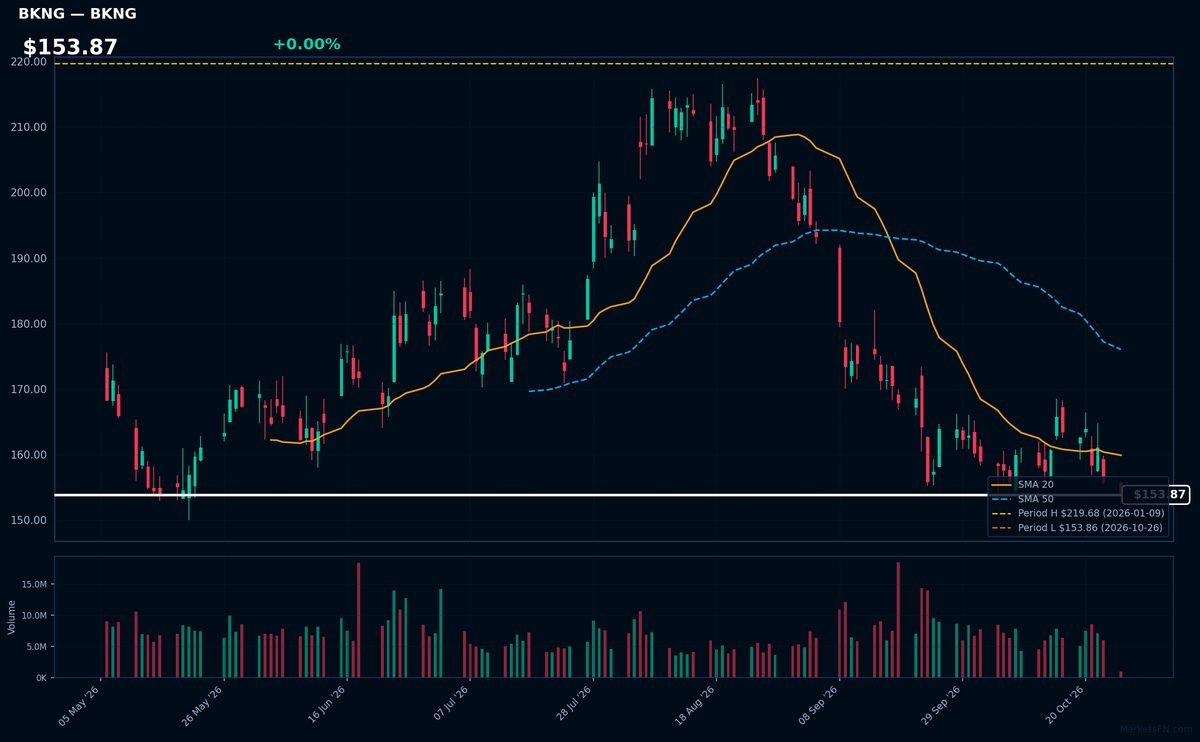
BKNG | Booking Holdings Inc | Consumer Cyclical | Price Last: $153.86 | % Realized: -26.79% | RSI: 35.9 | % above MA200: -13.6% | Trend: Below MA20, MA50, MA200
Booking Holdings operates leading online travel platforms (Booking.com, Priceline, Kayak) connecting travelers with lodging/transportation. Investors care because it dominates global online travel bookings with high-margin agency/model revenue, though cyclical exposure remains.
Technically concerning: RSI(14) at 35.9 shows near-oversold conditions, but bearish MA alignment (price < MA20 < MA50 < MA200) confirms sustained downtrend. Stock tests 52-week low (-26.8% YoY), signaling weak momentum.
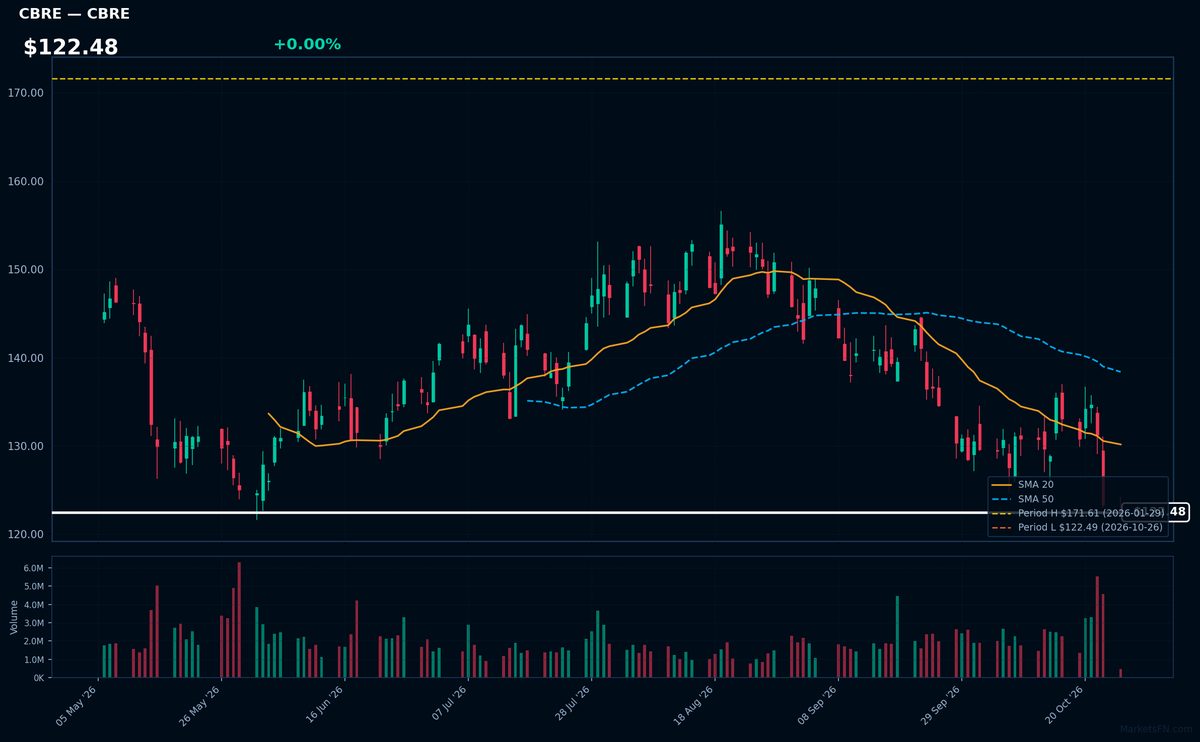
CBRE | CBRE Group Inc | Real Estate | Price Last: $122.49 | % Realized: -23.98% | RSI: 34.4 | % above MA200: -14.0% | Trend: Below MA20, MA50, MA200
CBRE Group Inc provides commercial real estate services including leasing, property sales, and investment management. Investors care as its cyclical performance tracks global CRE health, with advisory fees exposing it to transaction volumes amid rising rates.
Technically distressed: RSI(14) at 34.4 shows oversold conditions amid bearish MA alignment (price < MA20 < MA50 < MA200). Testing 52-week lows (-24.0% return) signals severe weakness.
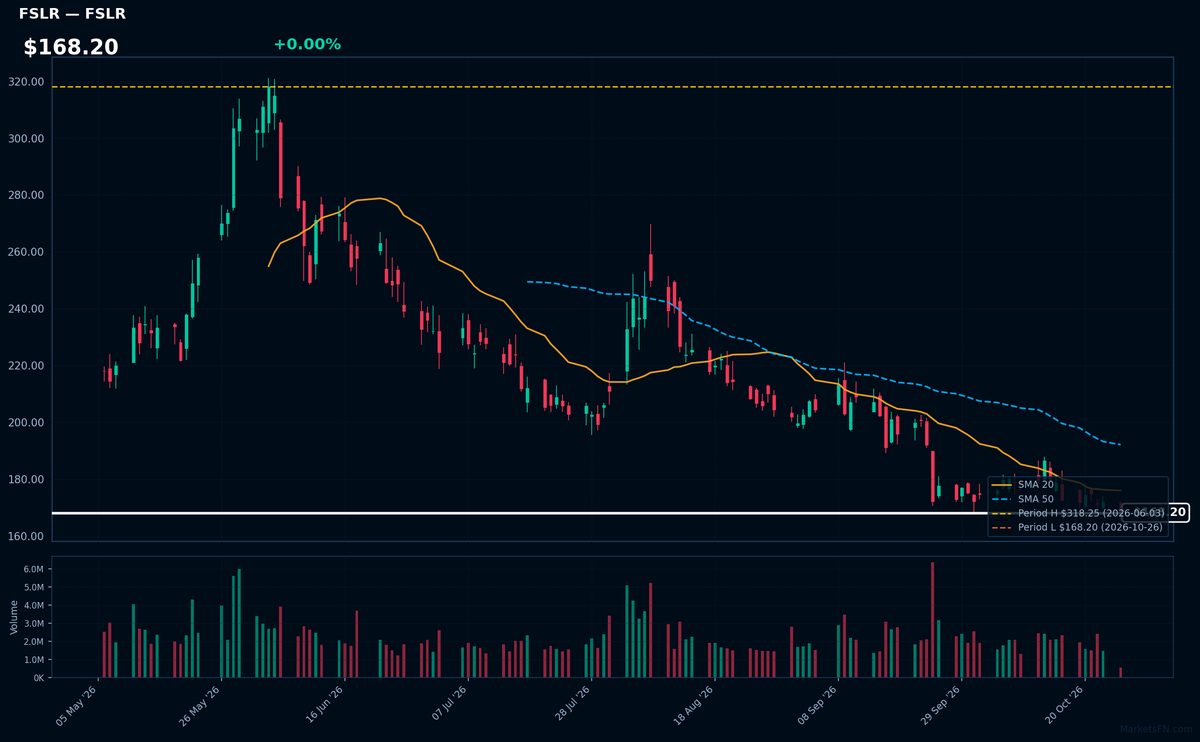
FSLR | First Solar Inc | Technology | Price Last: $168.20 | % Realized: -32.09% | RSI: 36.1 | % above MA200: -22.6% | Trend: Below MA20, MA50, MA200
First Solar manufactures thin-film solar panels using proprietary cadmium telluride technology, offering cost advantages in utility-scale projects. Investors watch FSLR as a pure-play on solar energy adoption, particularly in U.S. markets where its panels qualify for domestic content incentives under the Inflation Reduction Act.
Technically concerning: RSI(14) at 36.1 shows oversold conditions, but the bearish MA alignment (price < MA20 < MA50 < MA200) confirms sustained downtrend. Trading just 0.0% above 52-week lows after a -32.1% annual decline signals severe weakness, testing critical support levels.
Market Commentary
The clustering of S&P 500 stocks at 52-week extremes reflects divergent sector momentum and investor positioning. GILD, CTAS, NDAQ, TRGP, and IQV trading at 52-week highs suggest strength in healthcare (GILD, IQV), business services (CTAS, NDAQ), and energy infrastructure (TRGP), while NFLX, TMUS, BKNG, CBRE, and FSLR hovering near lows indicate pressure on streaming (NFLX), travel (BKNG), real estate services (CBRE), and solar (FSLR) despite T-Mobile's (TMUS) resilient telecom positioning. Such polarity often precedes sector rotation.
Macro drivers include yield-sensitive sectors benefiting from stable rates (healthcare, infrastructure) versus consumer discretionary (BKNG) and tech-adjacent names (NFLX, FSLR) facing growth concerns. Energy-linked TRGP's strength aligns with elevated commodity prices, while IQV and GILD highlight biopharma demand. Conversely, CBRE's weakness mirrors commercial real estate headwinds, and FSLR's lows reflect solar sector oversupply. These trends suggest a barbell strategy favoring defensive growth and energy over cyclical tech.
Key levels to monitor are the 52-week highs for IQV ($276.50) and TRGP ($120.18) as breakout confirmations, while NFLX ($485.00) and FSLR ($136.24) must hold their 52-week lows to avoid further downside. Catalysts include earnings revisions (BKNG, NDAQ), energy policy shifts (TRGP), and consumer spending data (NFLX, CBRE). Any break of these extremes could accelerate momentum trades in either direction.
Methodology: All 503 S&P 500 constituents screened. 52-week high = highest daily close over the past 252 trading days (approx. 1 year). 52-week low = lowest daily close over the same period. Distance = (current price / extreme − 1) × 100. Technical indicators computed on up to 1 year of daily OHLCV data.
Disclaimer: For informational purposes only. Not investment advice. Past performance is not indicative of future results.