Nasdaq 100 52-Week Highs & Lows Radar: Gilead Sciences, (GILD), Netflix (NFLX) and more
MarketsFN Team

Screening all 101 Nasdaq 100 constituents for stocks nearest to their 52-week high and their 52-week low. Data as of October 26, 2026. % Realized = 52-week total return.
Legend: RSI > 70 = overbought · RSI < 30 = oversold · Green % Realized = positive 52W return · Red = negative.
📈 Nearest to 52-Week High
Sectors represented: Industrials (2), Technology (2), Healthcare (1)
| Ticker | Company | Sector | Price Last | % Realized | 52-Week High Date | RSI | % above MA200 | Trend |
|---|---|---|---|---|---|---|---|---|
| GILD | Gilead Sciences, Inc | Healthcare | $158.45 | +31.53% | 2026-10-26 | 61.6 | +13.9% | Above MA20, MA50, MA200 |
| CTAS | Cintas Corporation | Industrials | $225.40 | +19.46% | 2026-10-26 | 79.3 | +18.8% | Above MA20, MA50, MA200 |
| CDW | CDW Corp | Technology | $164.54 | +3.33% | 2026-10-23 | 69.8 | +24.1% | Above MA20, MA50, MA200 |
| AAPL | Apple Inc | Technology | $346.78 | +29.01% | 2026-10-22 | 62.2 | +17.6% | Above MA20, MA50, MA200 |
| FAST | Fastenal Co | Industrials | $52.43 | +23.25% | 2026-10-22 | 60.1 | +11.5% | Above MA20, MA50, MA200 |
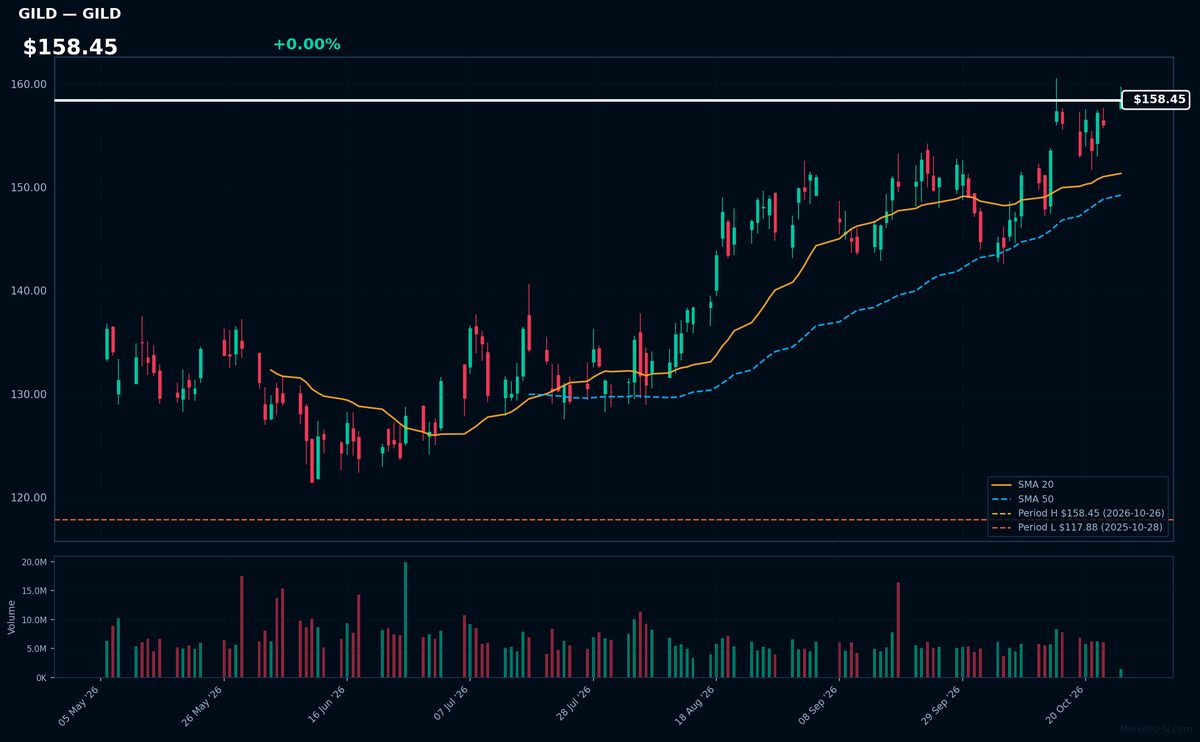
GILD | Gilead Sciences, Inc | Healthcare | Price Last: $158.45 | % Realized: +31.53% | RSI: 61.6 | % above MA200: +13.9% | Trend: Above MA20, MA50, MA200
Gilead Sciences is a biopharma leader in antiviral drugs (including HIV treatments) and oncology therapies. Investors care because its pipeline addresses high-need chronic conditions with durable revenue streams, though HIV patent cliffs loom.
Technically bullish: RSI(14) at 61.6 shows momentum without overbought risk, confirmed by price > MA20 > MA50 > MA200 alignment. Stock tests 52-week highs after 31.5% annual return.
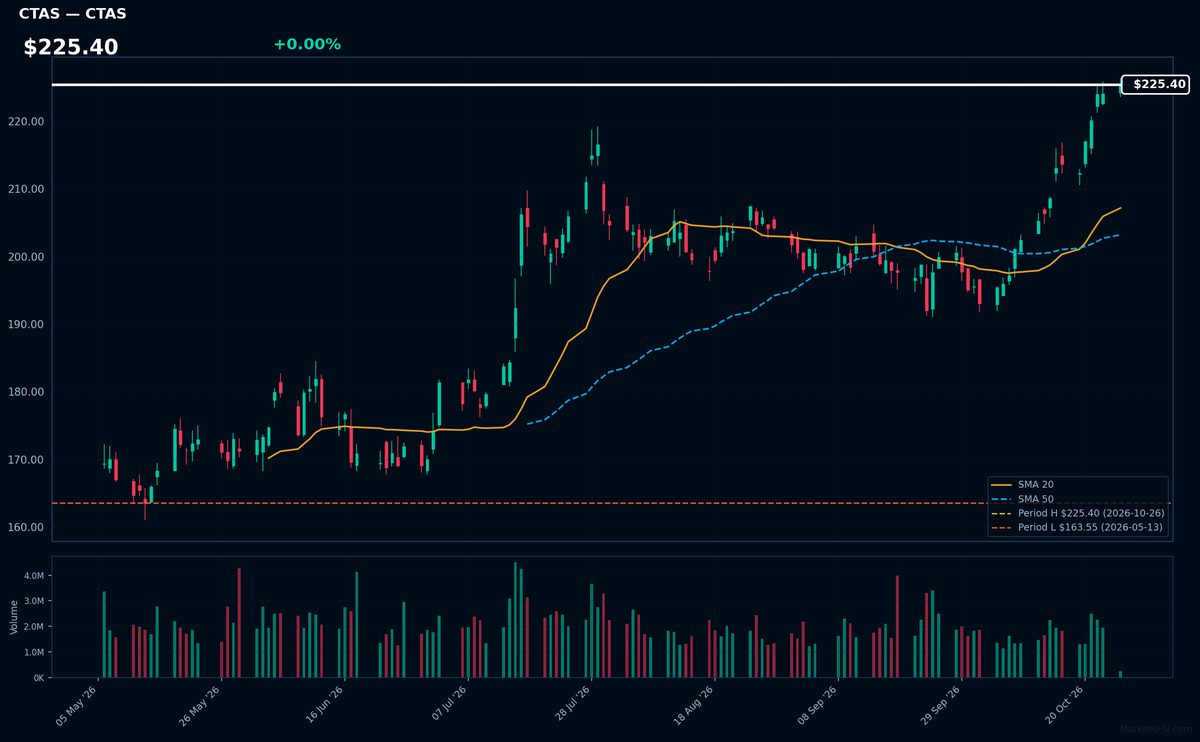
CTAS | Cintas Corporation | Industrials | Price Last: $225.40 | % Realized: +19.46% | RSI: 79.3 | % above MA200: +18.8% | Trend: Above MA20, MA50, MA200
Cintas provides corporate identity uniforms and business services (facility supplies, safety equipment) to over 1 million businesses. Investors care because its recession-resistant B2B model generates recurring revenue with high retention rates.
Technically overbought (RSI 79.3) but in strong uptrend (price > MA20 > MA50 > MA200). At 52-week highs after 19.5% annual return, suggesting momentum may be peaking.
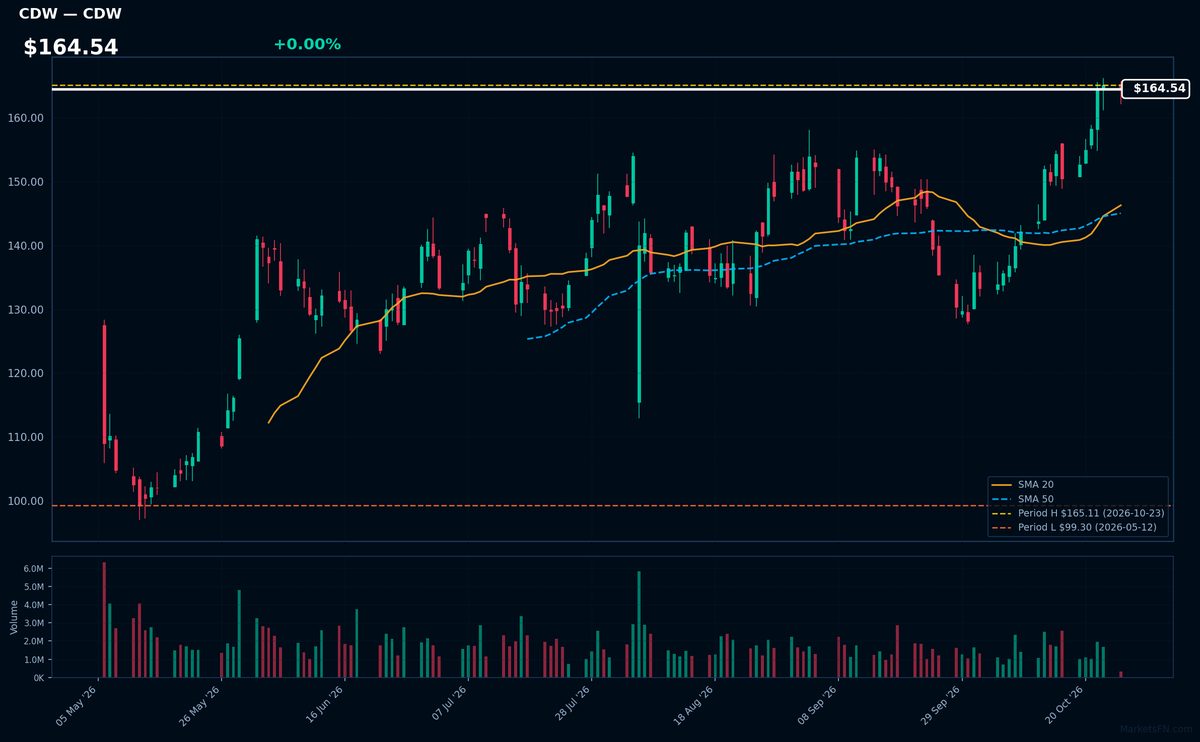
CDW | CDW Corp | Technology | Price Last: $164.54 | % Realized: +3.33% | RSI: 69.8 | % above MA200: +24.1% | Trend: Above MA20, MA50, MA200
CDW Corp is a leading provider of IT solutions to businesses, government, and education, offering hardware, software, and services. Investors should care because its diversified client base and value-added services drive consistent demand in the growing IT infrastructure market.
CDW shows bullish momentum with price ($164.54) above all key MAs (20/50/200) and RSI(14) at 69.8 — nearing overbought. At 0.3% below 52-week highs, the uptrend remains intact but warrants caution given elevated RSI. 3.3% annual return suggests steady accumulation.
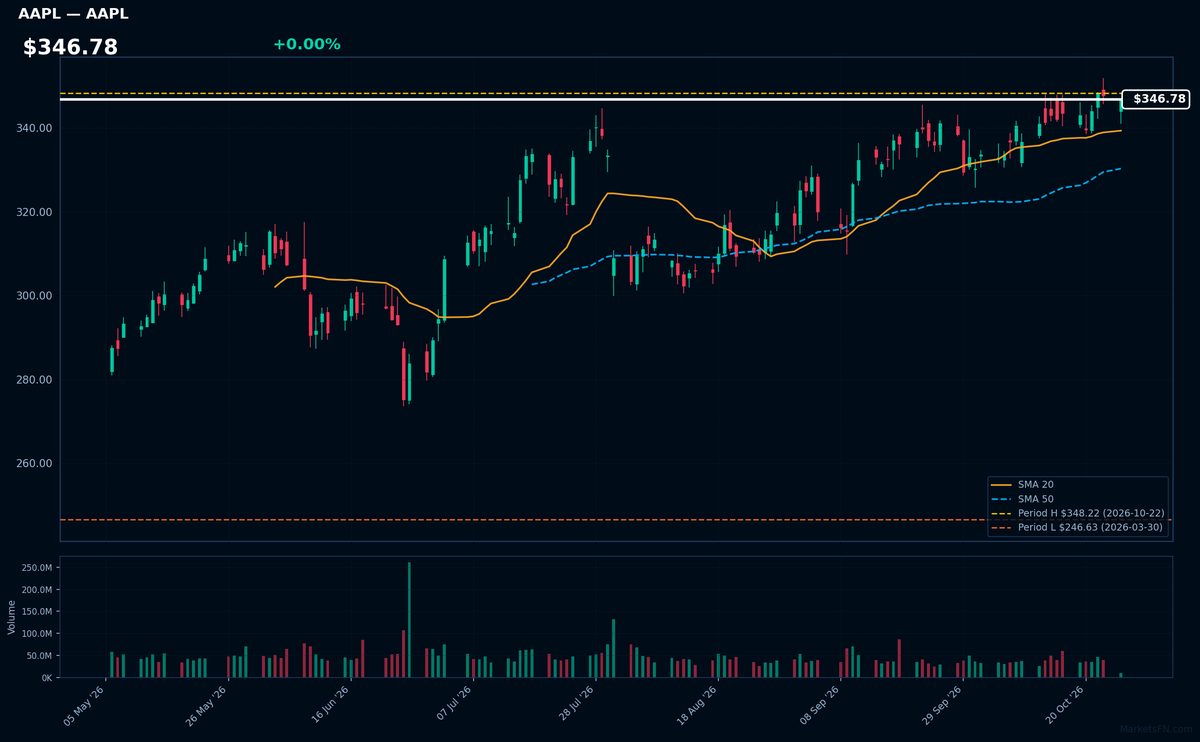
AAPL | Apple Inc | Technology | Price Last: $346.78 | % Realized: +29.01% | RSI: 62.2 | % above MA200: +17.6% | Trend: Above MA20, MA50, MA200
Apple Inc designs premium consumer electronics (iPhone, Mac), services (App Store, iCloud), and wearables (Apple Watch). Investors care because its ecosystem drives recurring revenue with 29.0% annual returns, blending hardware margins with high-margin services.
Technically bullish: $346.78 trades above all MAs (MA20>MA50>MA200) with RSI(14) at 62.2. Near breakout at 0.4% below 52-week high, suggesting sustained momentum.
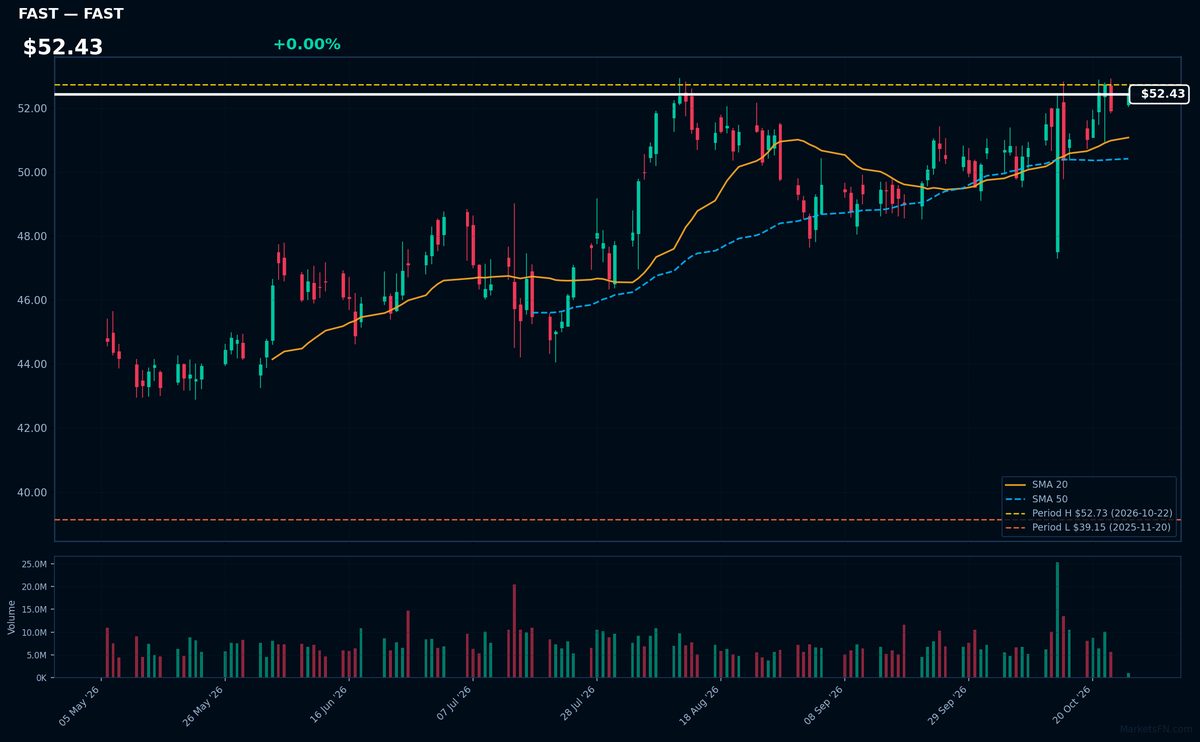
FAST | Fastenal Co | Industrials | Price Last: $52.43 | % Realized: +23.25% | RSI: 60.1 | % above MA200: +11.5% | Trend: Above MA20, MA50, MA200
Fastenal supplies industrial and construction supplies (fasteners, tools, safety equipment) via 3,300+ locations. Investors care because its vast distribution network and inventory management drive consistent growth in cyclical sectors, with 23.2% annual returns showing resilience.
Bullish MA alignment (price > MA20 > MA50 > MA200) and RSI(14) at 60.1 suggest sustained momentum, not overbought. Trading 0.6% below 52-week highs signals breakout potential.
📉 Nearest to 52-Week Low
Sectors represented: Communication Services (4), Consumer Cyclical (1)
| Ticker | Company | Sector | Price Last | % Realized | 52-Week Low Date | RSI | % above MA200 | Trend |
|---|---|---|---|---|---|---|---|---|
| NFLX | Netflix Inc | Communication Services | $64.34 | -41.22% | 2026-10-26 | 34.2 | -21.7% | Below MA20, MA50, MA200 |
| BKNG | Booking Holdings Inc | Consumer Cyclical | $153.35 | -27.04% | 2026-10-26 | 35.4 | -13.9% | Below MA20, MA50, MA200 |
| TMUS | T-Mobile US Inc | Communication Services | $146.55 | -33.59% | 2026-10-23 | 35.5 | -22.0% | Below MA20, MA50, MA200 |
| APP | Applovin Corp | Communication Services | $261.35 | -59.36% | 2026-10-23 | 36.5 | -38.3% | Below MA20, MA50, MA200 |
| CHTR | Charter Communications Inc | Communication Services | $106.18 | -56.74% | 2026-10-12 | 39.4 | -36.4% | Below MA20, MA50, MA200 |
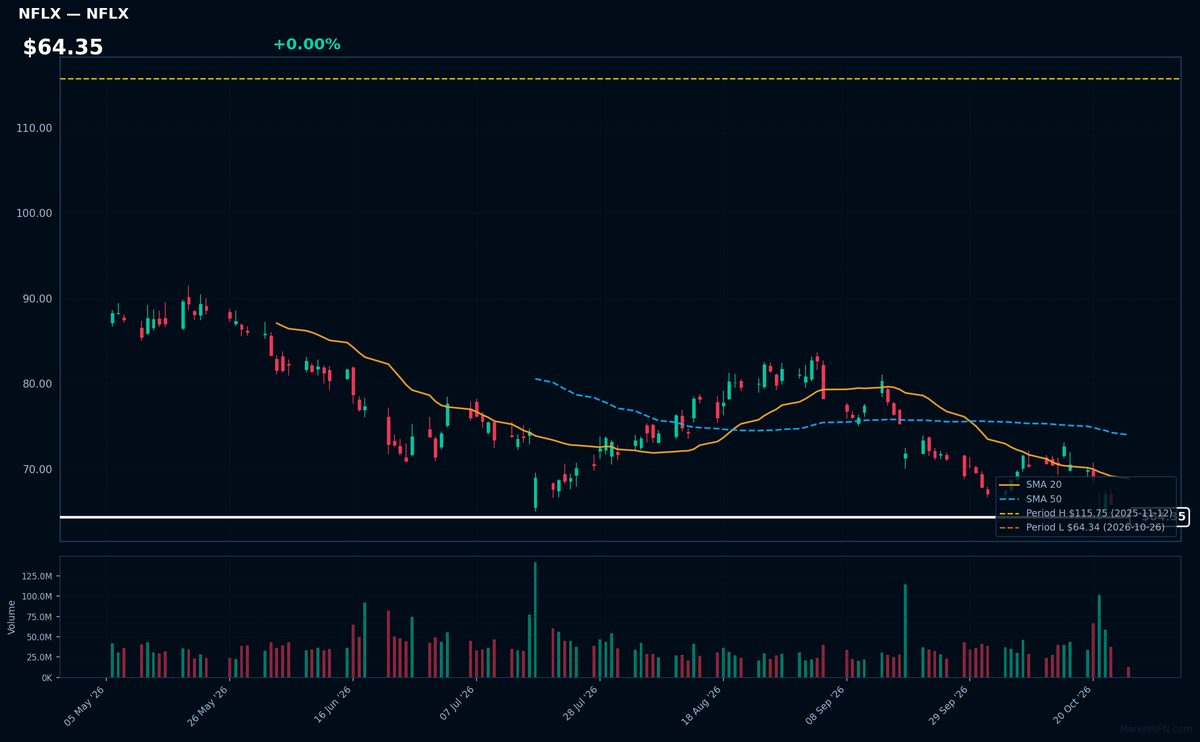
NFLX | Netflix Inc | Communication Services | Price Last: $64.34 | % Realized: -41.22% | RSI: 34.2 | % above MA200: -21.7% | Trend: Below MA20, MA50, MA200
Netflix Inc dominates global streaming with 220M+ subscribers, pioneering direct-to-consumer content. Investors watch for pricing power, international growth, and profitability shifts as it battles Disney+/HBO Max. Its model redefined entertainment economics.
Technically dire: RSI 34.2 shows oversold conditions amid bearish MA alignment (price < MA20 < MA50 < MA200). At 0.0% above 52-week lows after -41.2% plunge, this tests critical support.
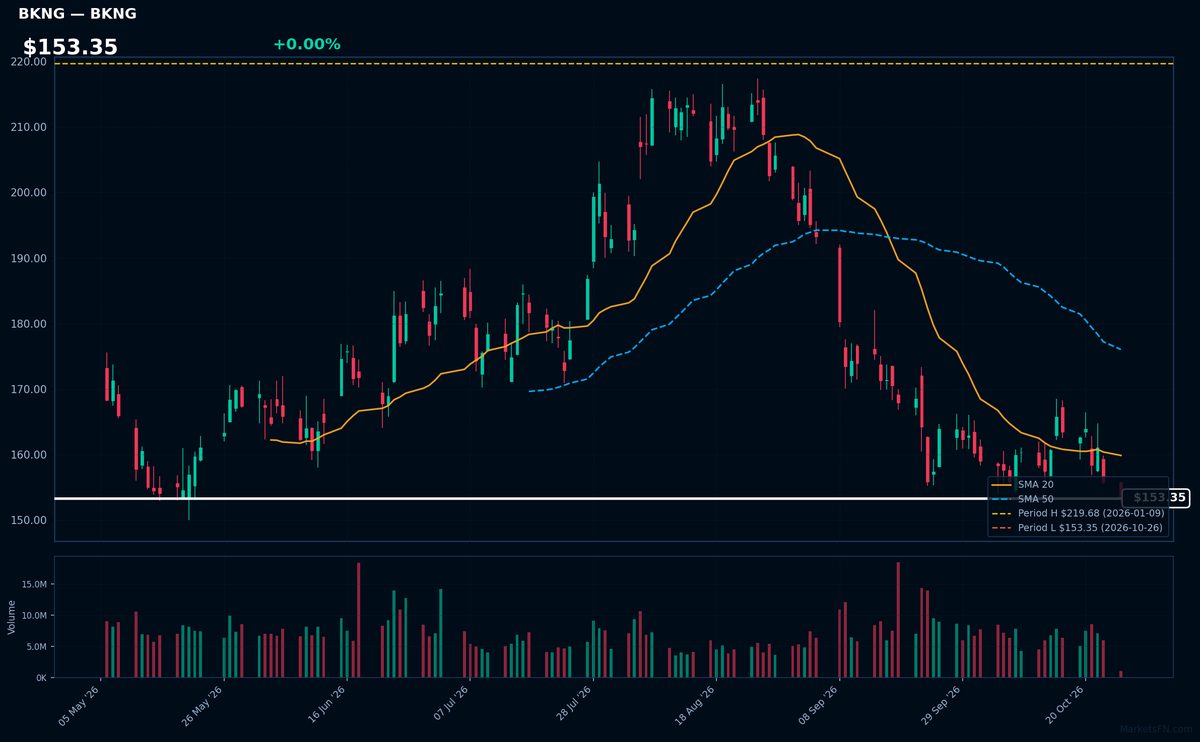
BKNG | Booking Holdings Inc | Consumer Cyclical | Price Last: $153.35 | % Realized: -27.04% | RSI: 35.4 | % above MA200: -13.9% | Trend: Below MA20, MA50, MA200
Booking Holdings operates leading online travel platforms (Booking.com, Priceline, Kayak) connecting travelers with lodging, flights, and rental cars. Investors care because it dominates global online travel with 27% market share, benefiting from secular growth in digital bookings despite cyclical exposure to travel demand.
Technically concerning: RSI(14) at 35.4 shows near-oversold conditions amid a sustained downtrend (price < MA20 < MA50 < MA200). Trading just 0.0% above 52-week lows after a 27.0% annual decline signals severe weakness, testing critical support levels.
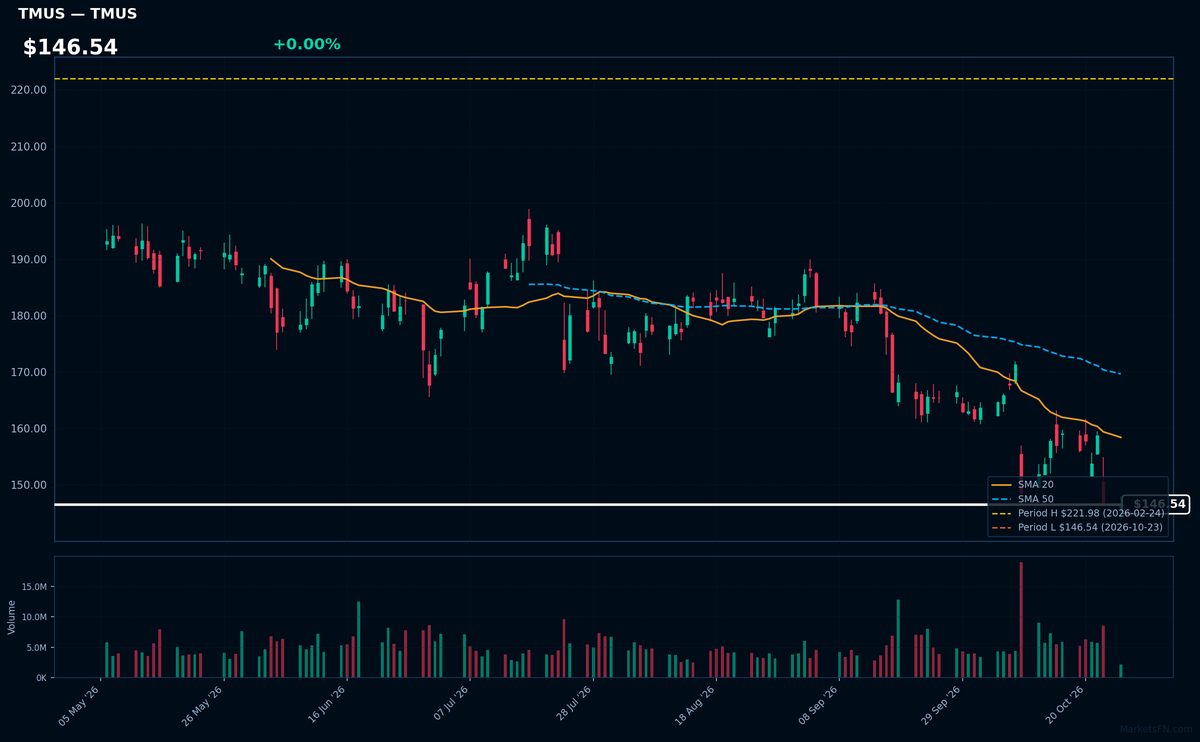
TMUS | T-Mobile US Inc | Communication Services | Price Last: $146.55 | % Realized: -33.59% | RSI: 35.5 | % above MA200: -22.0% | Trend: Below MA20, MA50, MA200
T-Mobile US Inc operates as a major wireless carrier in the U.S., competing with Verizon and AT&T. Investors watch TMUS for its growth in 5G adoption, aggressive pricing strategies, and potential market share gains in the telecom sector.
TMUS shows severe technical weakness: RSI(14) at 35.5 (approaching oversold), with a bearish MA alignment (price < MA20 < MA50 < MA200). The stock tests its 52-week low (0.0% above) after a -33.6% annual decline—a clear warning sign of sustained downtrend and weak momentum.
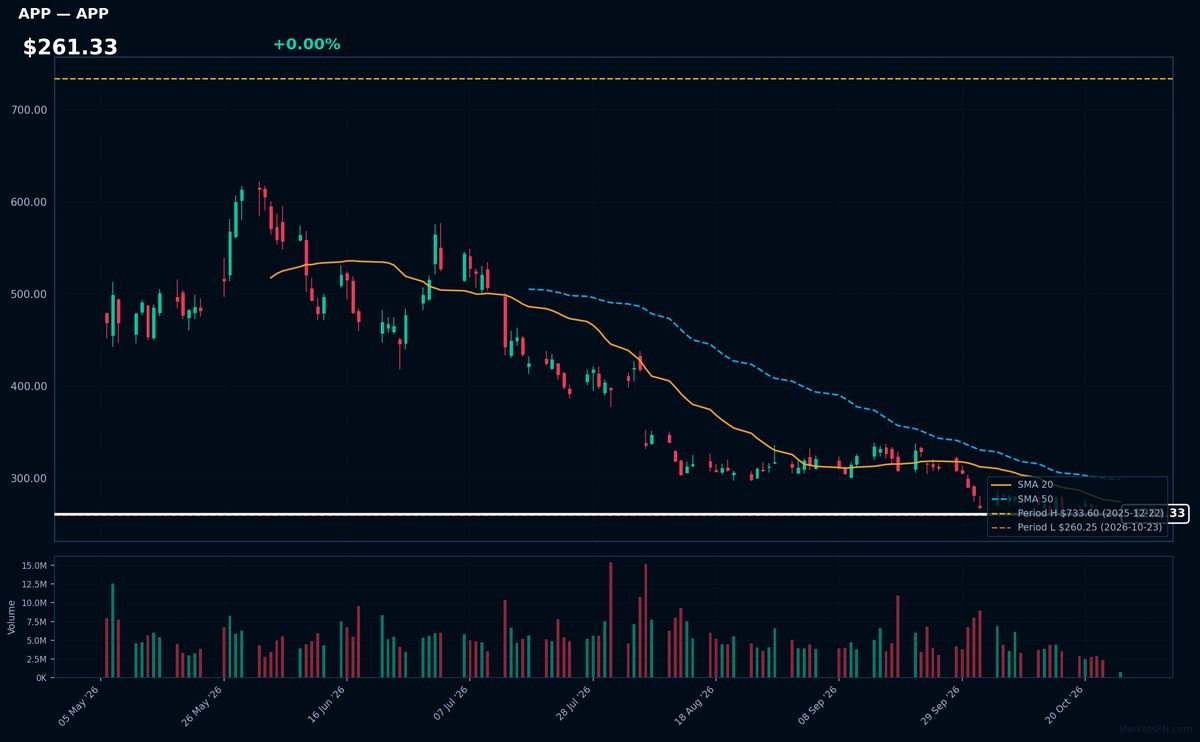
APP | Applovin Corp | Communication Services | Price Last: $261.35 | % Realized: -59.36% | RSI: 36.5 | % above MA200: -38.3% | Trend: Below MA20, MA50, MA200
Applovin operates a mobile app discovery platform and develops its own gaming apps, monetizing through in-app ads and purchases. Investors watch its ad-tech stack's performance amid mobile advertising volatility and Apple's privacy changes.
Technically dire: RSI 36.5 shows near-oversold but bearish MA alignment (price < MA20 < MA50 < MA200) confirms downtrend. Testing 52-week lows (-59.4% YTD) suggests capitulation, not opportunity.
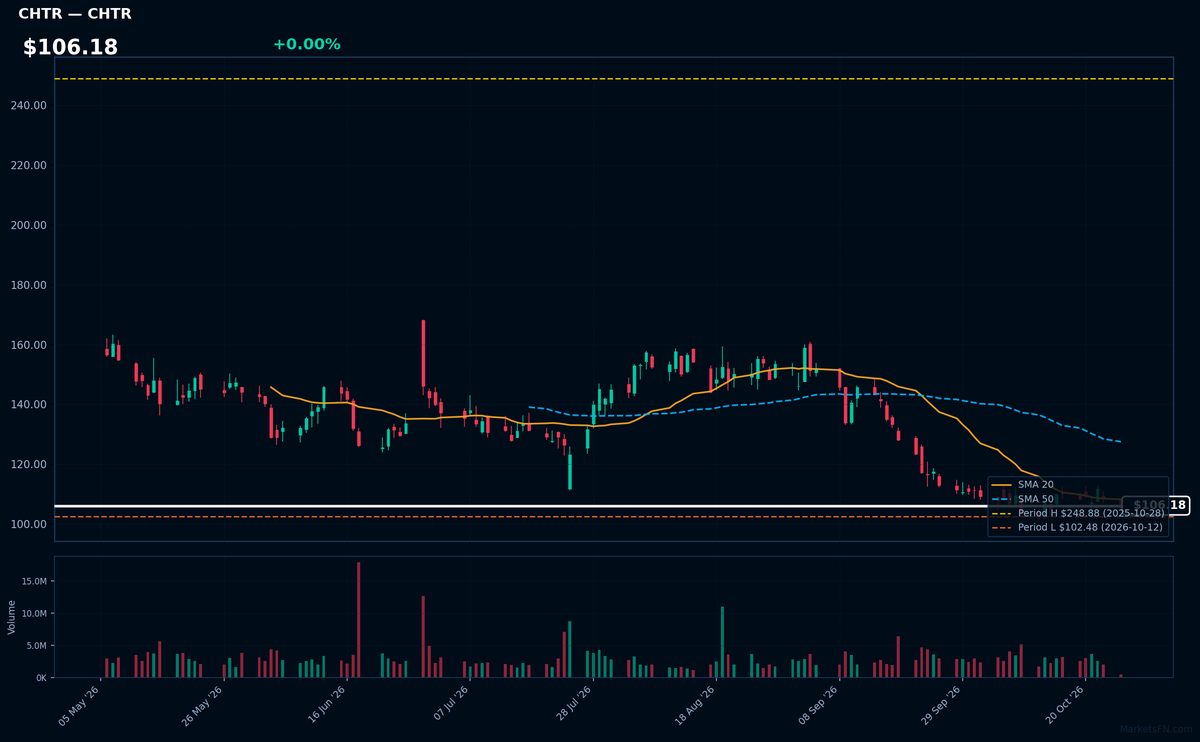
CHTR | Charter Communications Inc | Communication Services | Price Last: $106.18 | % Realized: -56.74% | RSI: 39.4 | % above MA200: -36.4% | Trend: Below MA20, MA50, MA200
Charter Communications operates as a cable broadband/telecom provider, offering essential connectivity services (internet, TV, phone) to 32M+ US customers. Investors watch CHTR as a key player in broadband infrastructure with recurring revenue streams, though heavy debt load and cord-cutting pressures impact valuation.
CHTR shows severe technical weakness: RSI(14) at 39.4 (approaching oversold) with sustained downtrend (price $106.18 below all key MAs). The stock hovers just 3.6% above 52-week lows after a -56.7% annual plunge — clear warning sign of persistent selling pressure without support levels in sight.
Market Commentary
The clustering of Nasdaq 100 stocks near 52-week extremes highlights divergent sector performance within tech. Gilead Sciences (GILD), Cintas (CTAS), and Apple (AAPL) hovering near highs suggests defensive rotation into healthcare, business services, and mega-cap resilience, while Netflix (NFLX), Booking (BKNG), and T-Mobile (TMUS) at lows reflects pressure on consumer discretionary and telecom names. This bifurcation signals selective risk appetite amid macroeconomic uncertainty.
Macro drivers include rising rates punishing growth-dependent firms (NFLX, BKNG) while rewarding cash-rich giants (AAPL) and stable earners (CTAS). Applovin (APP) and Charter (CHTR) near lows underscore ad-spend and broadband competition concerns, whereas GILD's strength aligns with biotech momentum. Sector leadership remains concentrated in profitable tech, with speculative names languishing.
Key levels to monitor: AAPL (-0.4% from high) and CDW (-0.3%) could confirm bullish momentum with new highs, while breakdown risks loom for NFLX and BKNG if they breach 52-week lows. Catalysts include earnings revisions, Fed policy shifts, and consumer spending data—any of which may accelerate rotations within the tech complex.
Methodology: All 101 Nasdaq 100 constituents screened. 52-week high = highest daily close over the past 252 trading days (approx. 1 year). 52-week low = lowest daily close over the same period. Distance = (current price / extreme − 1) × 100. Technical indicators computed on up to 1 year of daily OHLCV data.
Disclaimer: For informational purposes only. Not investment advice. Past performance is not indicative of future results.