S&P 500 52-Week Highs & Lows Radar: Berkshire Hathaway (BRK-B), Paramount Skydance (PSKY) and more
MarketsFN Team

Screening all 503 S&P 500 constituents for stocks nearest to their 52-week high and their 52-week low. Data as of October 20, 2026. % Realized = 52-week total return.
Legend: RSI > 70 = overbought · RSI < 30 = oversold · Green % Realized = positive 52W return · Red = negative.
📈 Nearest to 52-Week High
Sectors represented: Financial (3), Healthcare (2)
| Ticker | Company | Sector | Price Last | % Realized | 52-Week High Date | RSI | % above MA200 | Trend |
|---|---|---|---|---|---|---|---|---|
| BRK-B | Berkshire Hathaway Inc | Financial | $538.67 | +9.02% | 2026-10-20 | 78.9 | +9.1% | Above MA20, MA50, MA200 |
| LLY | Lilly(Eli) & Co | Healthcare | $1297.62 | +60.41% | 2026-10-20 | 70.8 | +20.0% | Above MA20, MA50, MA200 |
| V | Visa Inc | Financial | $407.50 | +18.32% | 2026-10-20 | 75.9 | +19.9% | Above MA20, MA50, MA200 |
| MA | Mastercard Incorporated | Financial | $621.67 | +9.77% | 2026-10-20 | 75.7 | +16.5% | Above MA20, MA50, MA200 |
| ABBV | Abbvie Inc | Healthcare | $288.41 | +24.28% | 2026-10-20 | 70.6 | +23.0% | Above MA20, MA50, MA200 |
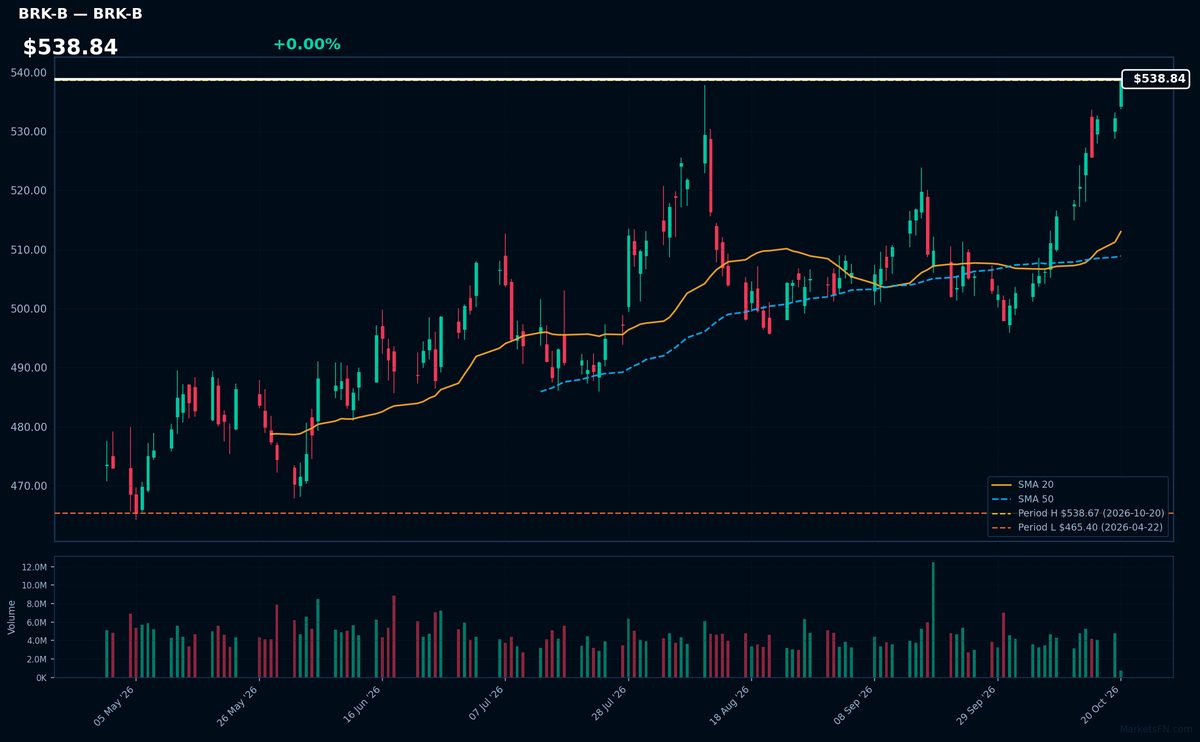
BRK-B | Berkshire Hathaway Inc | Financial | Price Last: $538.67 | % Realized: +9.02% | RSI: 78.9 | % above MA200: +9.1% | Trend: Above MA20, MA50, MA200
Berkshire Hathaway operates a massive insurance business (GEICO, reinsurance) while investing its float in wholly-owned subsidiaries (BNSF, utilities) and public equities (Apple, Coca-Cola). Investors care for its unique capital allocation under Buffett/Munger, combining cash-generating operating businesses with market-beating investments.
Technically bullish with RSI(14) at 78.9 (overbought) and price > MA20 > MA50 > MA200. Stock tests 52-week high (+9.0% YoY) — extended momentum that may precede consolidation given extreme RSI.
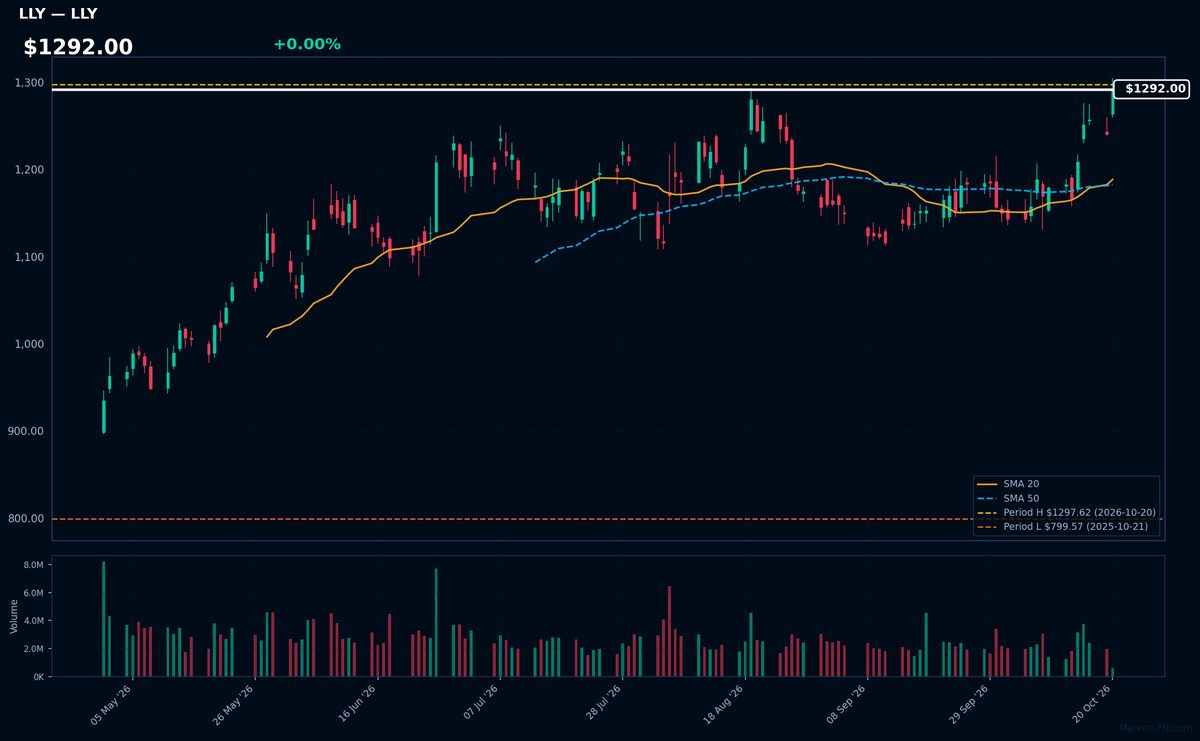
LLY | Lilly(Eli) & Co | Healthcare | Price Last: $1297.62 | % Realized: +60.41% | RSI: 70.8 | % above MA200: +20.0% | Trend: Above MA20, MA50, MA200
Lilly(Eli) & Co is a pharmaceutical leader in diabetes (Trulicity, Mounjaro) and Alzheimer's (donanemab), with obesity drugs driving recent growth. Investors care because its biologic pipeline commands premium pricing and patent protection in high-demand therapeutic areas.
Technically overbought (RSI 70.8) but bullish (price $1292 > MA20 > MA50 > MA200), testing 52-week highs after 60.4% annual gains. Momentum extreme warrants caution despite trend strength.
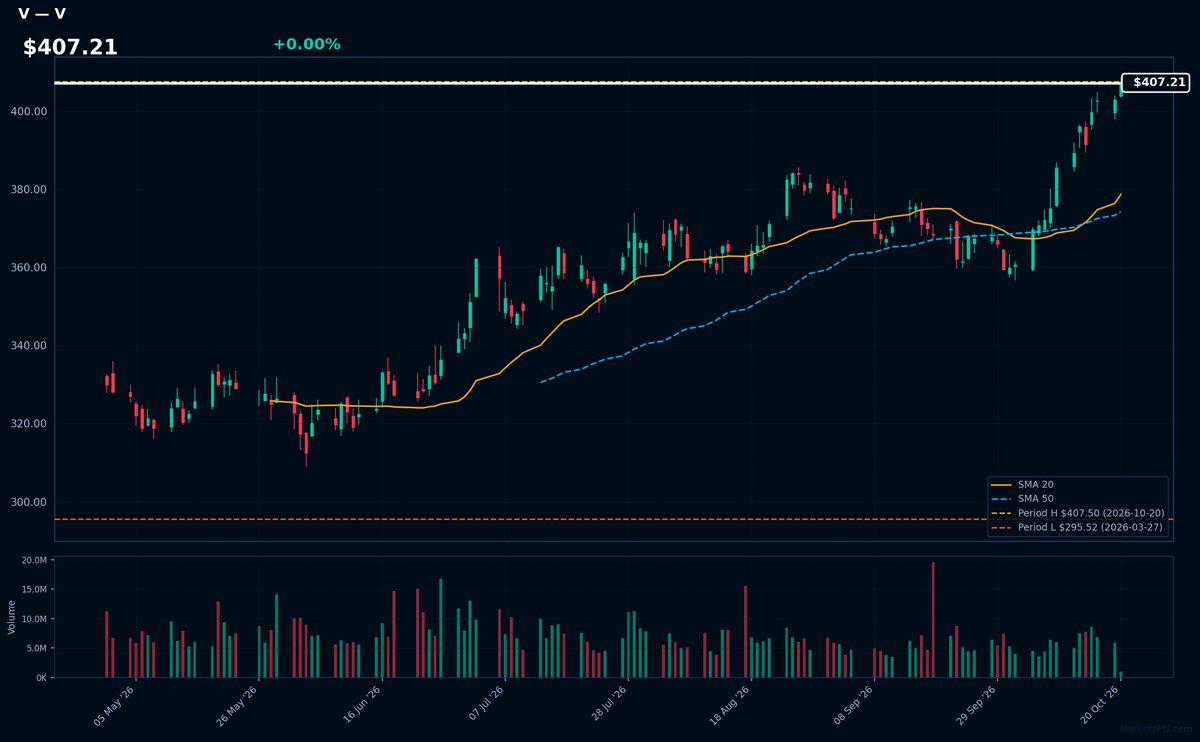
V | Visa Inc | Financial | Price Last: $407.50 | % Realized: +18.32% | RSI: 75.9 | % above MA200: +19.9% | Trend: Above MA20, MA50, MA200
Visa operates the world's largest payment network, processing $14.4 trillion annually across 200+ countries. Investors care because digital payment growth is structural (18.3% 52-week return), with Visa's 75%+ market share in credit/debit creating a toll-road on global commerce.
Technically overbought (RSI 75.9) but in strong uptrend (price > MA20 > MA50 > MA200). At 52-week high, momentum suggests continuation unless RSI triggers reversal.
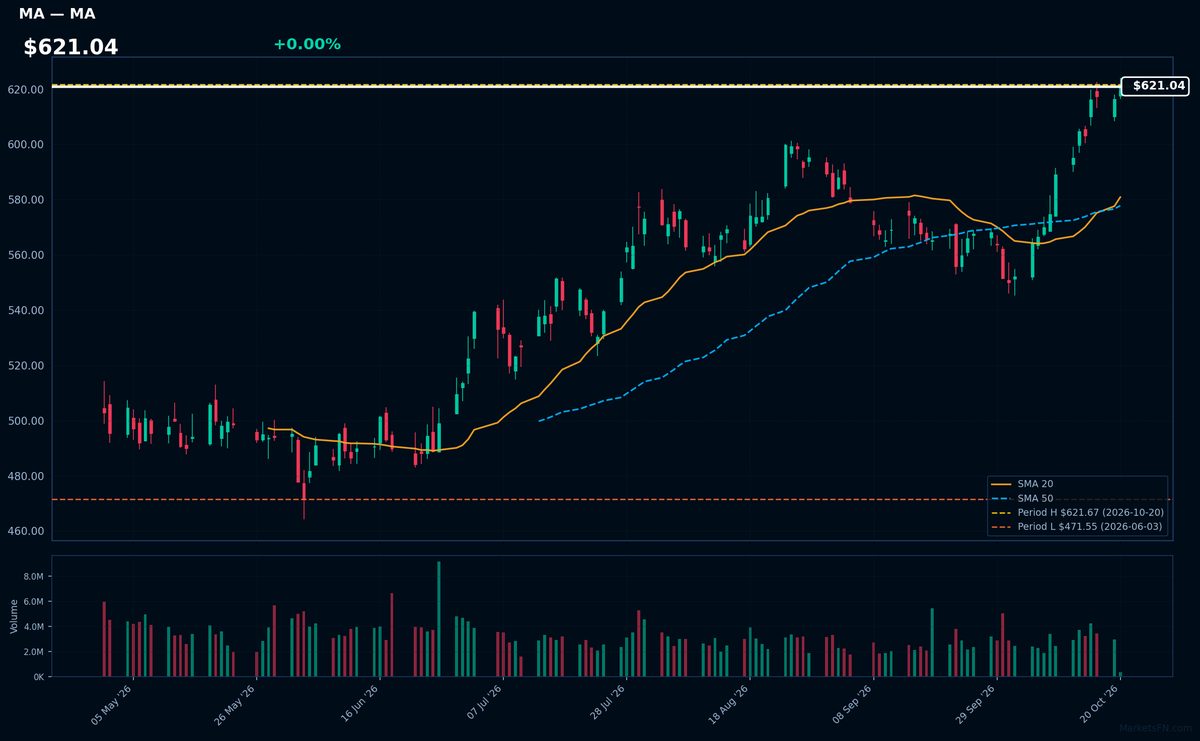
MA | Mastercard Incorporated | Financial | Price Last: $621.67 | % Realized: +9.77% | RSI: 75.7 | % above MA200: +16.5% | Trend: Above MA20, MA50, MA200
Mastercard operates the world's second-largest payment network, processing $8T+ in annual transactions. Investors care because its asset-light model (no loan risk) generates 50%+ operating margins as digital payments grow globally, with pricing power from its entrenched network effect.
Technically overbought (RSI 75.7) but in strong uptrend (price > MA20 > MA50 > MA200). At 52-week highs with 9.8% annual return, this reflects momentum but risks short-term pullback given extreme RSI.
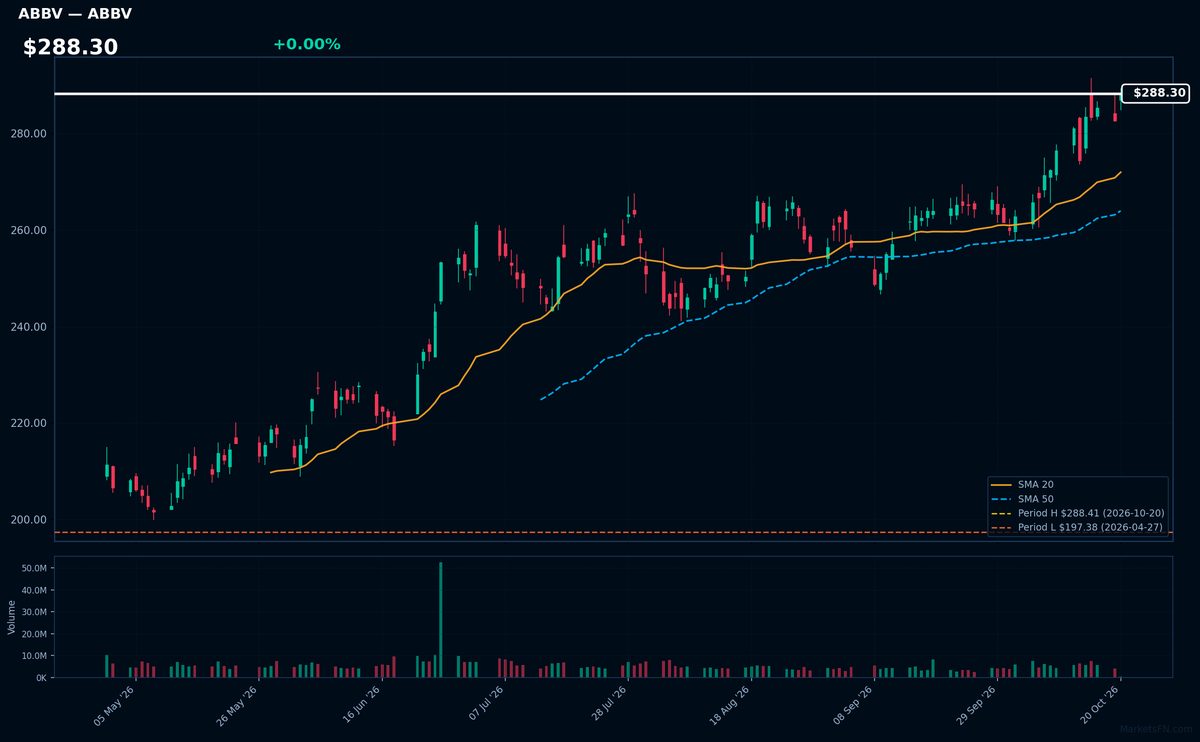
ABBV | Abbvie Inc | Healthcare | Price Last: $288.41 | % Realized: +24.28% | RSI: 70.6 | % above MA200: +23.0% | Trend: Above MA20, MA50, MA200
AbbVie Inc develops and markets immunology (Humira), oncology (Imbruvica), and neuroscience (Botox) therapies. Investors care due to its high-margin biologic drugs, pipeline depth in autoimmune diseases, and post-Humira patent cliff diversification efforts.
Technically bullish: RSI(14) at 70.6 shows overbought momentum, but sustained uptrend confirmed by price > MA20 > MA50 > MA200 alignment. Stock tests 52-week high (0.0% below), up 24.3% YoY.
📉 Nearest to 52-Week Low
Sectors represented: Consumer Cyclical (2), Communication Services (1), Basic Materials (1), Technology (1)
| Ticker | Company | Sector | Price Last | % Realized | 52-Week Low Date | RSI | % above MA200 | Trend |
|---|---|---|---|---|---|---|---|---|
| PSKY | Paramount Skydance Corp | Communication Services | $6.91 | -13.08% | 2026-10-16 | 34.7 | — | — |
| MOS | Mosaic Company | Basic Materials | $17.83 | -39.71% | 2026-10-20 | 22.3 | -26.3% | Below MA20, MA50, MA200 |
| MGM | MGM Resorts International | Consumer Cyclical | $28.51 | -10.54% | 2026-10-19 | 17.8 | -27.5% | Below MA20, MA50, MA200 |
| LKQ | LKQ Corp | Consumer Cyclical | $21.67 | -28.01% | 2026-10-19 | 36.1 | -21.8% | Below MA20, MA50, MA200 |
| FSLR | First Solar Inc | Technology | $173.16 | -24.38% | 2026-10-19 | 39.1 | -20.9% | Below MA20, MA50, MA200 |
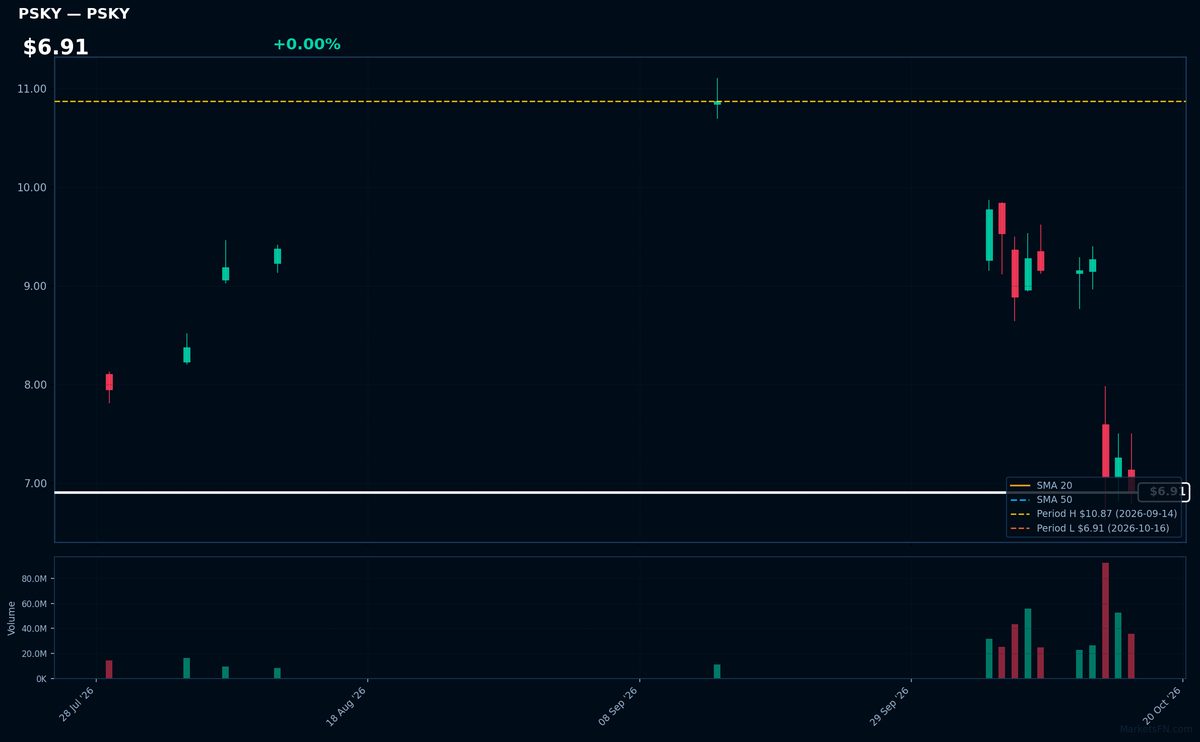
PSKY | Paramount Skydance Corp | Communication Services | Price Last: $6.91 | % Realized: -13.08% | RSI: 34.7 | % above MA200: — | Trend: —
Paramount Skydance Corp operates in [industry/sector not provided in data]. Investors should monitor its extreme proximity to 52-week lows (-13.1% annual return) for potential turnaround or further downside, given the absence of fundamental data points in the provided metrics.
Technically concerning — PSKY trades just 0.0% above 52-week lows with oversold RSI(14) at 34.7. MA alignment data is incomplete, but the -13.1% annual return and support retest suggest bearish momentum, not fundamental strength. Extreme low proximity warrants caution.
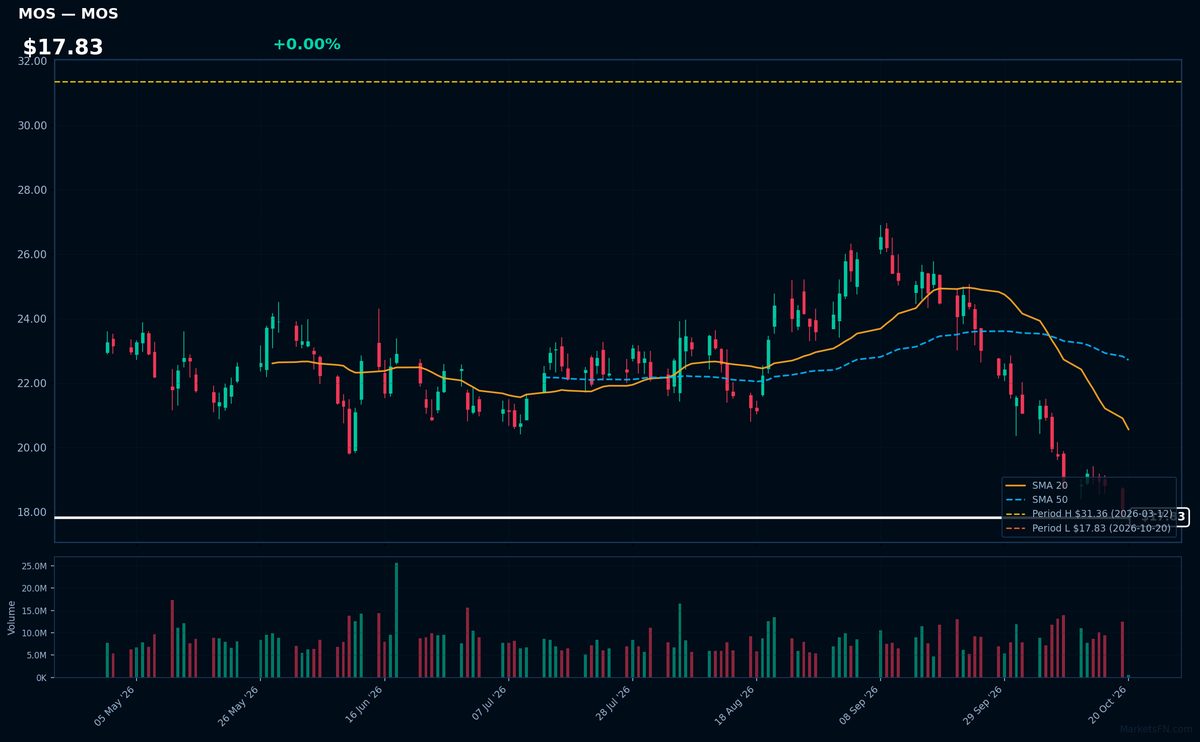
MOS | Mosaic Company | Basic Materials | Price Last: $17.83 | % Realized: -39.71% | RSI: 22.3 | % above MA200: -26.3% | Trend: Below MA20, MA50, MA200
Mosaic Company produces concentrated phosphate and potash crop nutrients, serving global agricultural markets. Investors care because its fertilizers directly impact food production efficiency, making it a cyclical play on agricultural commodity demand and farm economics.
Technically extreme: RSI(14) at 22.3 signals oversold, but bearish MA alignment (price < MA20 < MA50 < MA200) confirms sustained downtrend. Stock tests 52-week low after -39.7% plunge—warning sign.
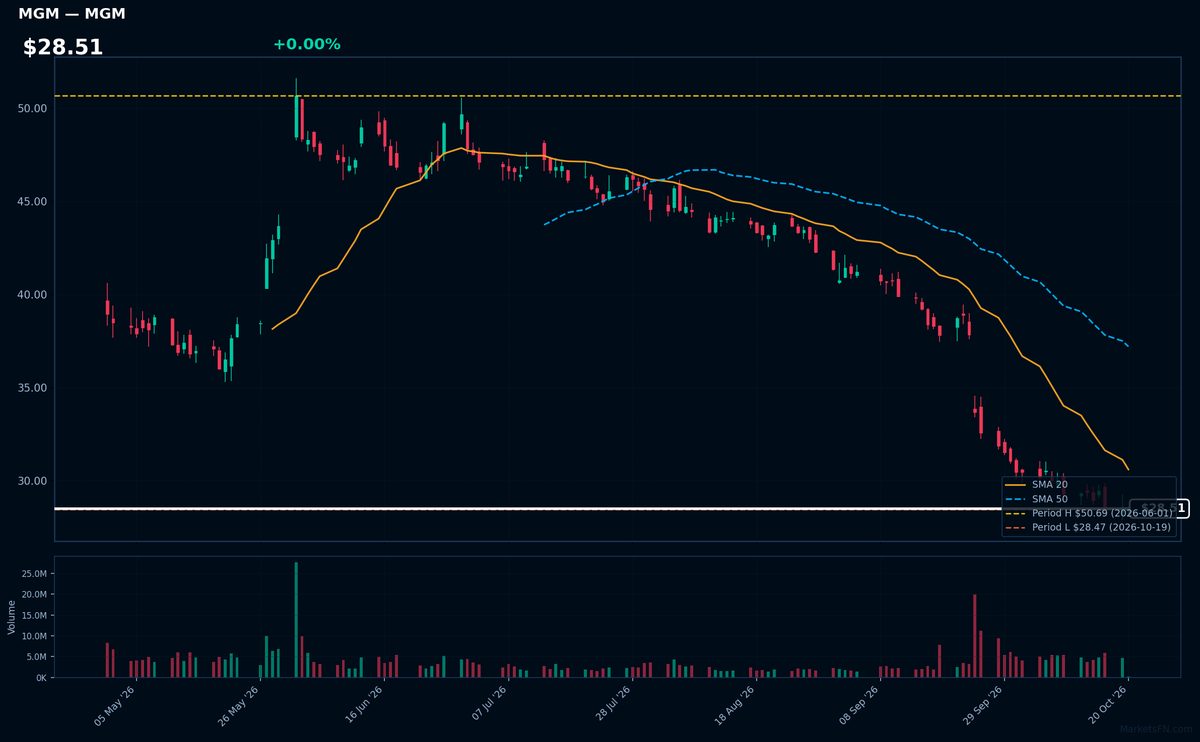
MGM | MGM Resorts International | Consumer Cyclical | Price Last: $28.51 | % Realized: -10.54% | RSI: 17.8 | % above MA200: -27.5% | Trend: Below MA20, MA50, MA200
MGM Resorts operates iconic Las Vegas Strip properties (Bellagio, MGM Grand) and regional casinos, deriving 70% of revenue from high-margin gaming. Investors track its China exposure through Macau joint ventures and digital betting growth via BetMGM, making it a pure-play on discretionary recovery and gaming expansion.
Technically distressed: RSI(14) at 17.8 (severely oversold) with bearish MA alignment (price $28.51 < MA20 < MA50 < MA200). Testing 52-week low support (-10.5% annual return) — either capitulation or value trap given extreme proximity to lows.
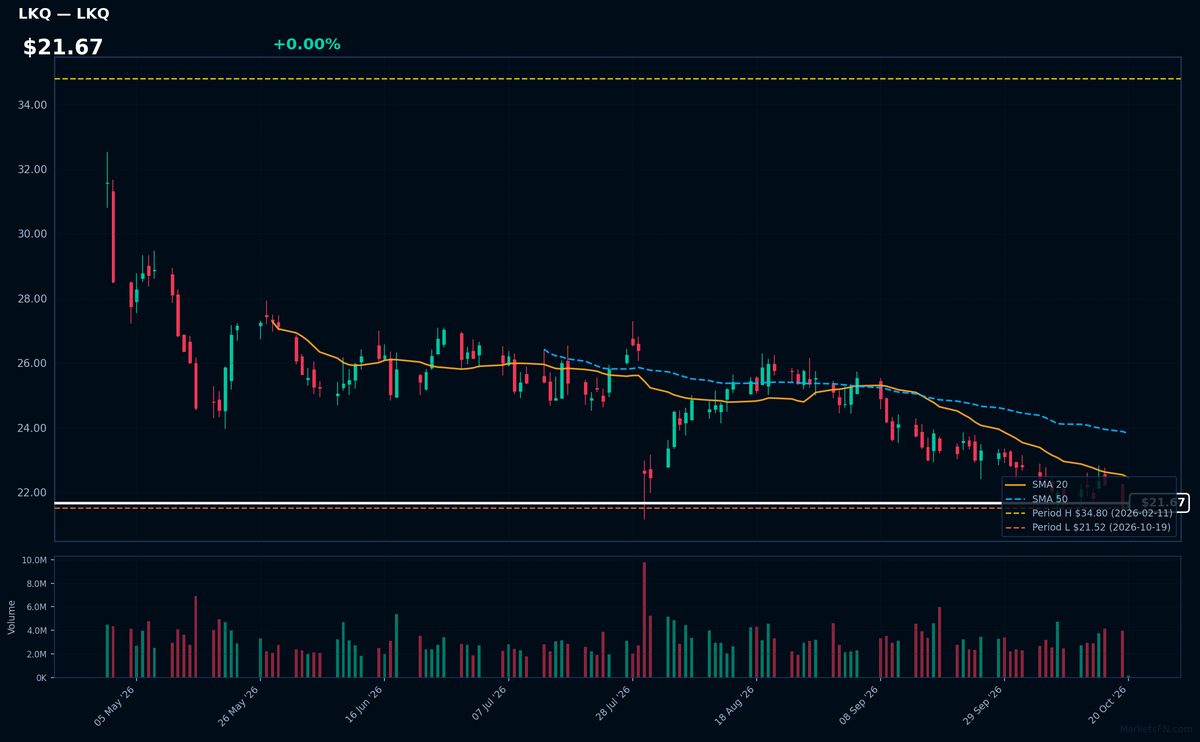
LKQ | LKQ Corp | Consumer Cyclical | Price Last: $21.67 | % Realized: -28.01% | RSI: 36.1 | % above MA200: -21.8% | Trend: Below MA20, MA50, MA200
LKQ Corp distributes aftermarket auto parts and recycled OEM components, serving collision repair shops globally. Investors watch LKQ as a cyclical play on vehicle miles driven and insurance claims volume, with pricing power in a fragmented industry.
Technically dire: RSI(14) at 36.1 shows oversold conditions amid bearish MA alignment (price < MA20 < MA50 < MA200). Trading just 0.7% above 52-week lows after -28.0% decline, this signals capitulation, not opportunity.
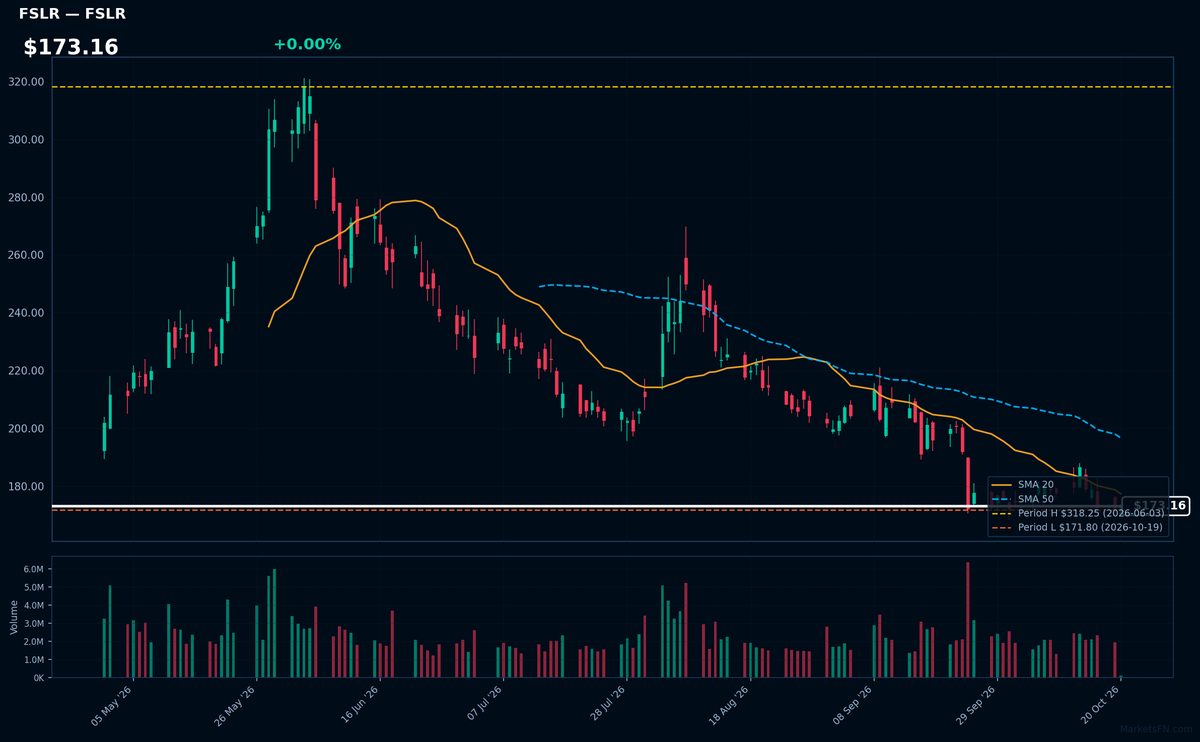
FSLR | First Solar Inc | Technology | Price Last: $173.16 | % Realized: -24.38% | RSI: 39.1 | % above MA200: -20.9% | Trend: Below MA20, MA50, MA200
First Solar Inc manufactures thin-film solar panels using proprietary cadmium telluride technology, offering cost and durability advantages in utility-scale projects. Investors watch FSLR as a pure-play on solar energy adoption, particularly in U.S. markets benefiting from Inflation Reduction Act incentives.
Technically concerning: RSI(14) at 39.1 shows weakening momentum, with bearish MA alignment (price < MA20 < MA50 < MA200) and shares just 0.8% above 52-week lows after a 24.4% annual decline. Tests critical support.
Market Commentary
The concentration of blue-chip stocks like BRK-B, LLY, V, MA, and ABBV at 52-week highs signals persistent investor preference for quality and defensive growth. These companies share characteristics of strong cash flows, pricing power, and recession-resistant business models—attributes favored amid lingering macro uncertainty. Conversely, stocks near 52-week lows (PSKY, MOS, MGM, LKQ, FSLR) reflect sector-specific pressures, from cyclical downturns to structural challenges in media and commodities.
The divergence underscores a "barbell" strategy in markets: investors are crowding into healthcare (LLY, ABBV) and payments (V, MA) while fleeing cyclical exposures like fertilizers (MOS) and solar (FSLR). This aligns with expectations of prolonged higher rates, which disproportionately impact capital-intensive industries. Media (PSKY) and gaming (MGM) face secular pressures, while LKQ's proximity to lows suggests auto aftermarket softness.
Key levels to monitor are the 52-week highs for the leaders—any breakout could signal extended momentum. For laggards, a sustained move above their 52-week lows (particularly for FSLR at +0.8% and LKQ at +0.7%) may indicate bottoming. Catalysts include Fed policy shifts for cyclicals, earnings revisions for growth stocks, and regulatory developments in solar/media. Strict adherence to price levels is critical given the tight ranges.
Methodology: All 503 S&P 500 constituents screened. 52-week high = highest daily close over the past 252 trading days (approx. 1 year). 52-week low = lowest daily close over the same period. Distance = (current price / extreme − 1) × 100. Technical indicators computed on up to 1 year of daily OHLCV data.
Disclaimer: For informational purposes only. Not investment advice. Past performance is not indicative of future results.