Nasdaq 100 52-Week Highs & Lows Radar: Automatic Data Processing (ADP), Copart, (CPRT) and more
MarketsFN Team

Screening all 101 Nasdaq 100 constituents for stocks nearest to their 52-week high and their 52-week low. Data as of October 20, 2026. % Realized = 52-week total return.
Legend: RSI > 70 = overbought · RSI < 30 = oversold · Green % Realized = positive 52W return · Red = negative.
📈 Nearest to 52-Week High
Sectors represented: Technology (2), Consumer Defensive (2), Healthcare (1)
| Ticker | Company | Sector | Price Last | % Realized | 52-Week High Date | RSI | % above MA200 | Trend |
|---|---|---|---|---|---|---|---|---|
| ADP | Automatic Data Processing Inc | Technology | $291.26 | +2.91% | 2026-10-20 | 70.9 | +21.9% | Above MA20, MA50, MA200 |
| TEAM | Atlassian Corporation | Technology | $217.57 | +37.02% | 2026-10-20 | 65.9 | +89.2% | Above MA20, MA50, MA200 |
| CCEP | Coca-Cola Europacific Partners Plc | Consumer Defensive | $112.62 | +24.06% | 2026-10-20 | 72.5 | +13.0% | Above MA20, MA50, MA200 |
| KDP | Keurig Dr Pepper Inc | Consumer Defensive | $34.82 | +25.48% | 2026-10-20 | 69.8 | +17.2% | Above MA20, MA50, MA200 |
| BIIB | Biogen Inc | Healthcare | $240.82 | +64.24% | 2026-10-20 | 69.0 | +21.4% | Above MA20, MA50, MA200 |
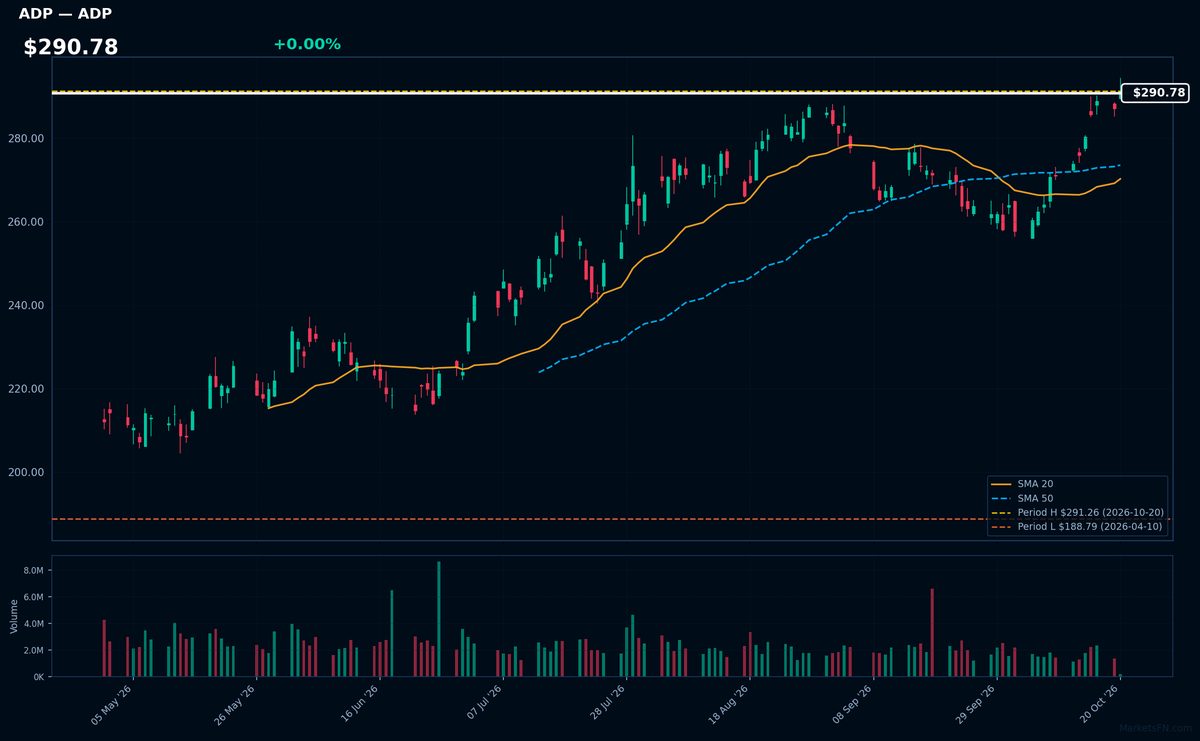
ADP | Automatic Data Processing Inc | Technology | Price Last: $291.26 | % Realized: +2.91% | RSI: 70.9 | % above MA200: +21.9% | Trend: Above MA20, MA50, MA200
ADP provides payroll processing and HR solutions to businesses globally, handling critical back-office functions. Investors care because recurring revenue from payroll services creates stable cash flows, while HR tech expansion offers growth potential in a fragmented market.
Technically, ADP shows mixed signals at $290.78 (0.0% below 52W high) with overbought RSI(14) at 70.9 and price above MA20/MA50/MA200. The 2.9% annual return suggests consolidation near highs rather than strong momentum.
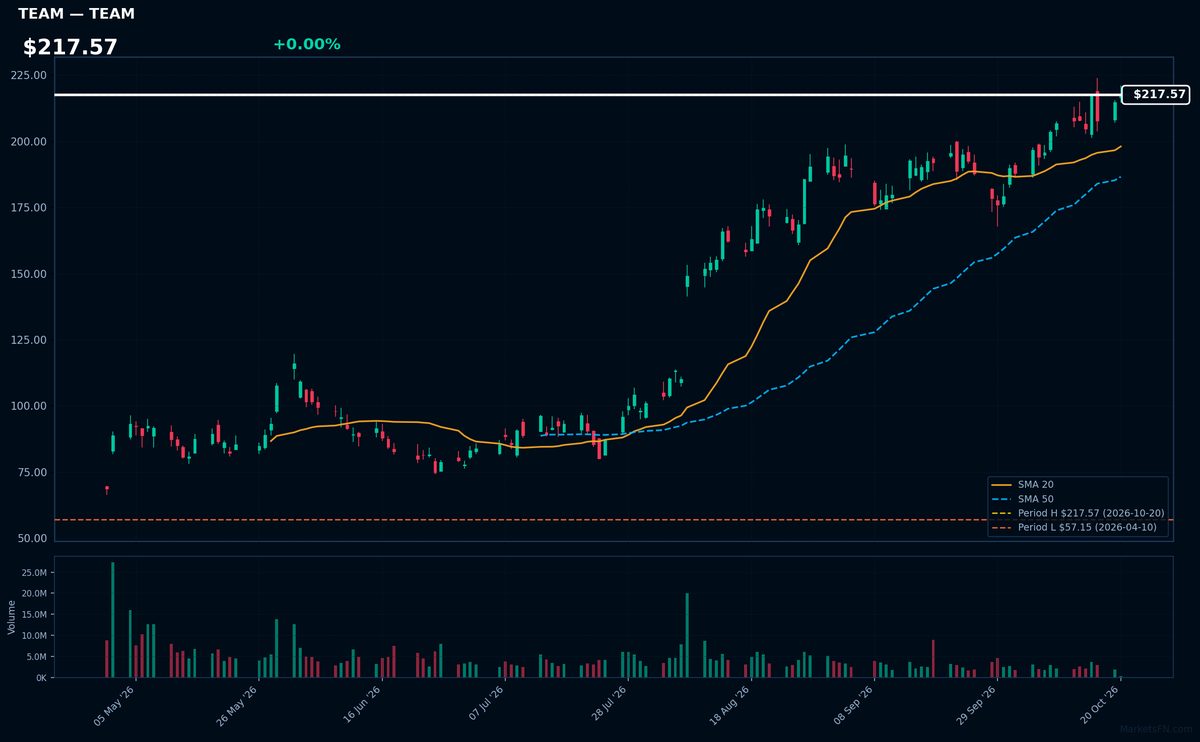
TEAM | Atlassian Corporation | Technology | Price Last: $217.57 | % Realized: +37.02% | RSI: 65.9 | % above MA200: +89.2% | Trend: Above MA20, MA50, MA200
Atlassian provides collaboration software (Jira, Confluence) for agile development teams. Investors care because its tools are mission-critical for software companies, driving sticky subscriptions with 37% annual growth as enterprises digitize workflows.
Technically bullish (RSI 65.9, price > MA20 > MA50 > MA200) but extended - stock tests 52-week high after 37% rally. Watch for exhaustion.
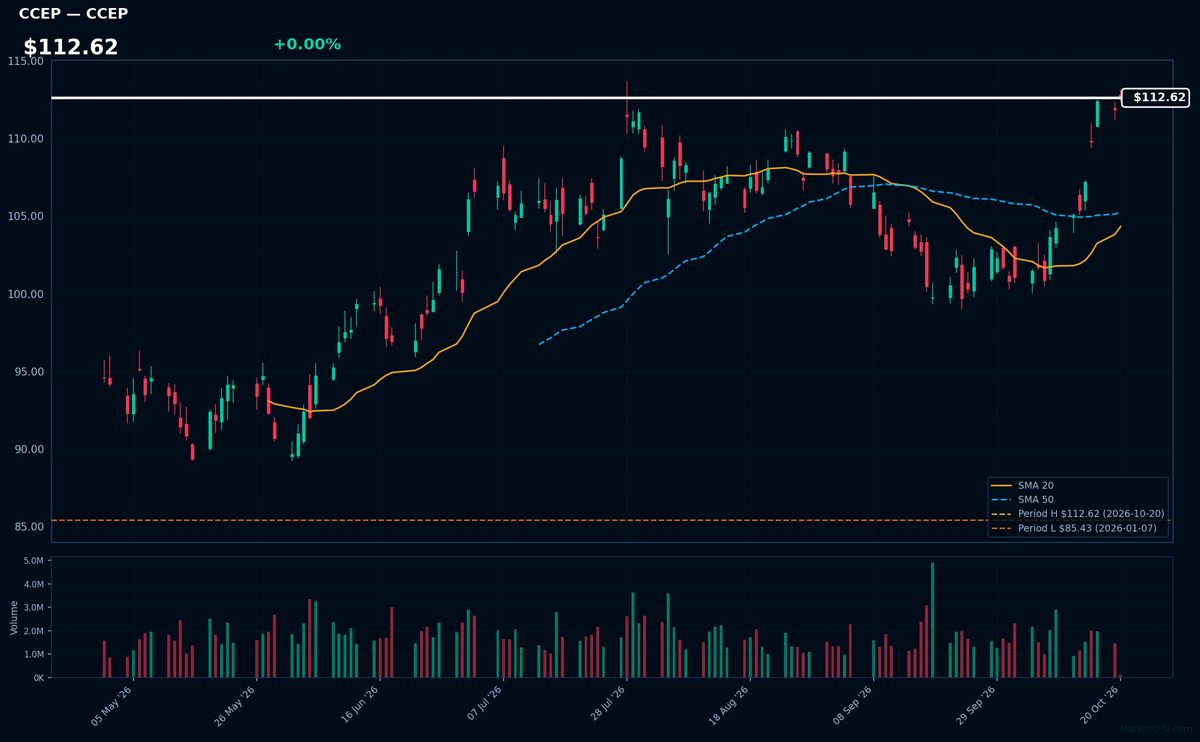
CCEP | Coca-Cola Europacific Partners Plc | Consumer Defensive | Price Last: $112.62 | % Realized: +24.06% | RSI: 72.5 | % above MA200: +13.0% | Trend: Above MA20, MA50, MA200
Coca-Cola Europacific Partners Plc bottles and distributes Coca-Cola products across Europe and Asia-Pacific. Investors care because it combines Coca-Cola's brand power with exposure to emerging markets, offering stable cash flows and growth potential in non-US markets.
Technically overbought (RSI 72.5) near 52-week highs (+24.1%), with mixed MA alignment. Current momentum suggests caution as extreme RSI warns of potential pullback despite bullish price action.
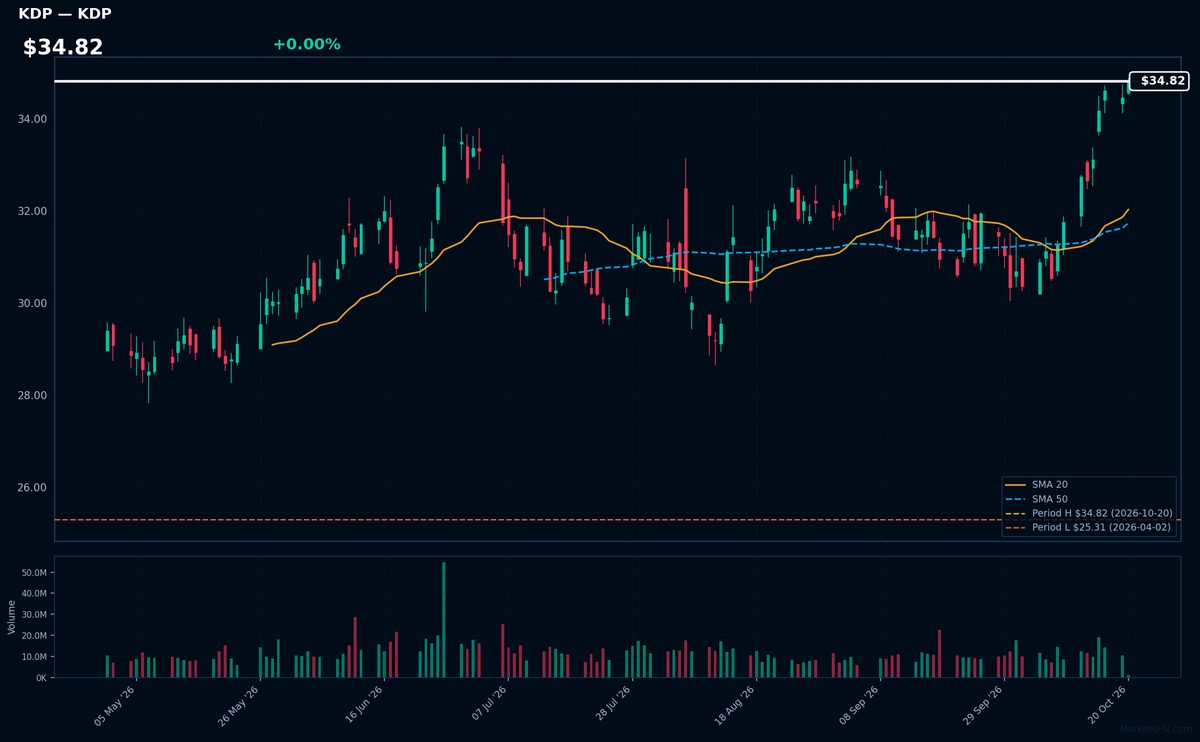
KDP | Keurig Dr Pepper Inc | Consumer Defensive | Price Last: $34.82 | % Realized: +25.48% | RSI: 69.8 | % above MA200: +17.2% | Trend: Above MA20, MA50, MA200
Keurig Dr Pepper Inc (KDP) manufactures single-serve coffee systems (Keurig) and distributes branded beverages (Dr Pepper, Snapple). Investors care for its dual exposure to premium at-home coffee consumption and stable CSD/RTD beverage demand, creating a defensive growth profile in consumer staples.
Technically bullish with RSI(14) at 69.8 and price > MA20 > MA50 > MA200, testing 52-week highs (+25.5% YoY). Momentum suggests continuation but RSI nears overbought. MA alignment confirms sustained uptrend.
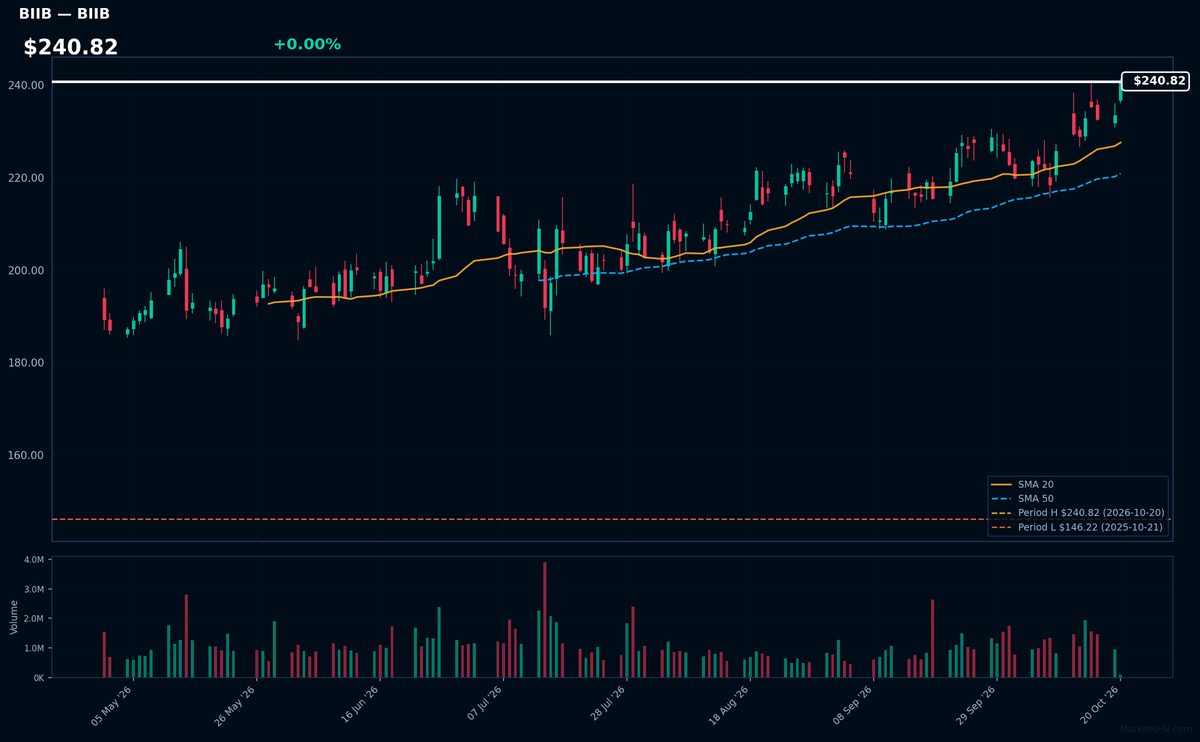
BIIB | Biogen Inc | Healthcare | Price Last: $240.82 | % Realized: +64.24% | RSI: 69.0 | % above MA200: +21.4% | Trend: Above MA20, MA50, MA200
Biogen specializes in neuroscience therapies, notably for multiple sclerosis and Alzheimer's disease. Investors watch its controversial Alzheimer's drug Leqembi's rollout and pipeline progress in neurodegenerative diseases, where treatment breakthroughs command premium pricing.
Technically bullish with RSI(14) at 69.0 (near overbought) and price > MA20 > MA50 > MA200. Stock sits at 52-week high after 64.2% annual gain — extended momentum that warrants caution despite trend alignment.
📉 Nearest to 52-Week Low
Sectors represented: Communication Services (3), Industrials (1), Consumer Cyclical (1)
| Ticker | Company | Sector | Price Last | % Realized | 52-Week Low Date | RSI | % above MA200 | Trend |
|---|---|---|---|---|---|---|---|---|
| CPRT | Copart, Inc | Industrials | $26.79 | -40.15% | 2026-10-14 | 40.1 | -18.2% | Below MA20, MA50, MA200 |
| APP | Applovin Corp | Communication Services | $273.12 | -51.74% | 2026-10-14 | 41.0 | -36.6% | Below MA20, MA50, MA200 |
| NFLX | Netflix Inc | Communication Services | $70.19 | -43.33% | 2026-10-02 | 44.9 | -15.1% | Above MA20 · Below MA50, MA200 |
| TTD | Trade Desk Inc | Communication Services | $12.52 | -76.16% | 2026-10-06 | 46.7 | -40.6% | Above MA20 · Below MA50, MA200 |
| BKNG | Booking Holdings Inc | Consumer Cyclical | $163.90 | -20.31% | 2026-05-15 | 46.1 | -8.6% | Above MA20 · Below MA50, MA200 |
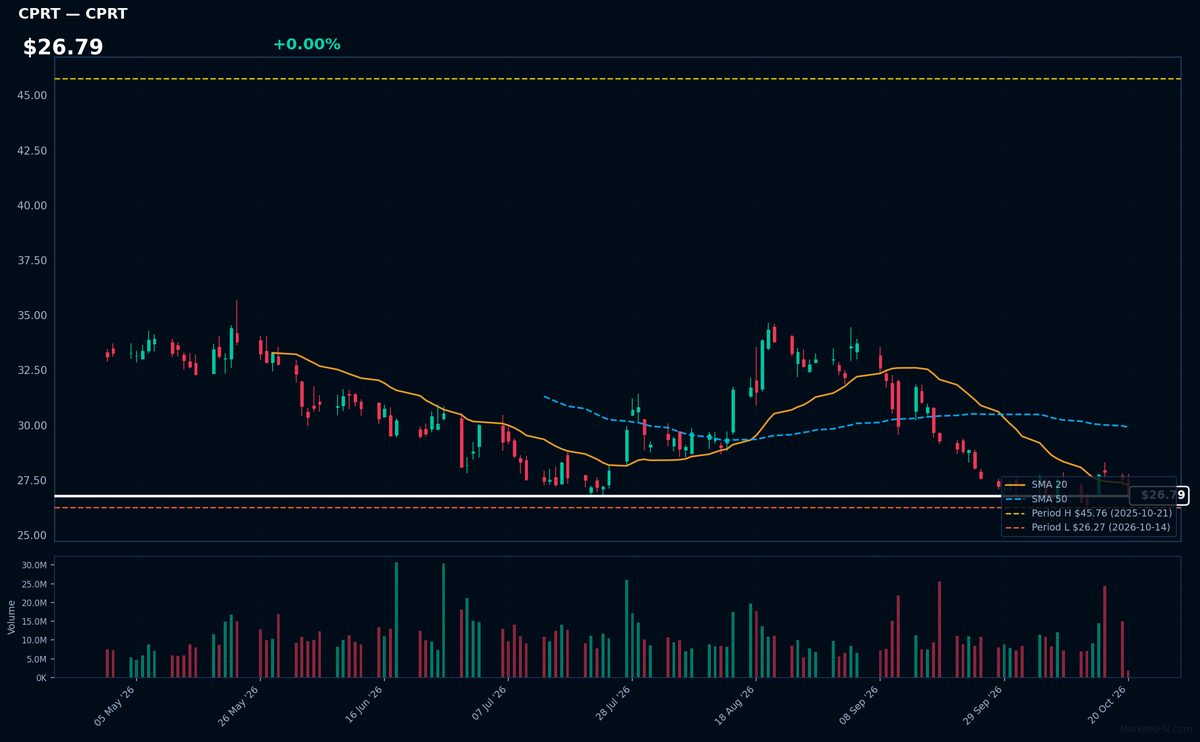
CPRT | Copart, Inc | Industrials | Price Last: $26.79 | % Realized: -40.15% | RSI: 40.1 | % above MA200: -18.2% | Trend: Below MA20, MA50, MA200
Copart operates an online vehicle auction platform, specializing in salvage and used cars for insurers, dealers, and individuals. Investors watch its asset-light model and exposure to insurance claims cycles.
Technically distressed: RSI(14) at 40.1 shows weakening momentum amid a sustained downtrend (price < MA20 < MA50 < MA200). At just 2.0% above 52-week lows, this tests critical support after a -40.1% annual plunge.
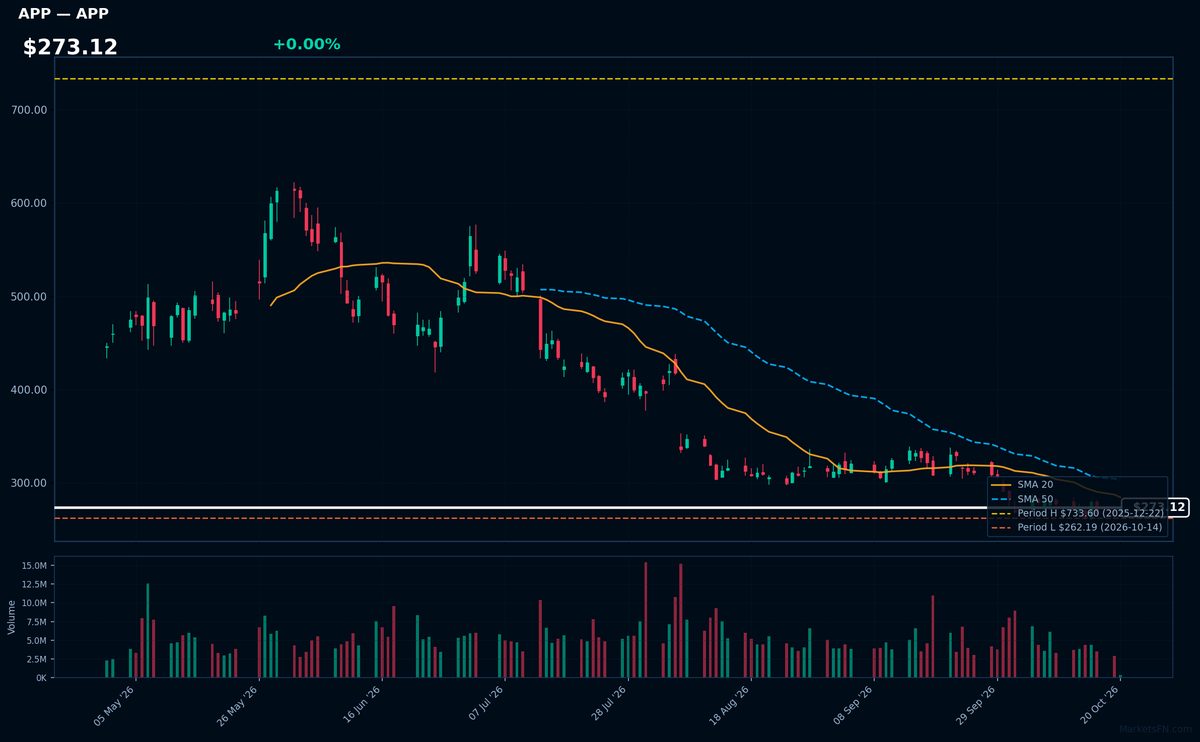
APP | Applovin Corp | Communication Services | Price Last: $273.12 | % Realized: -51.74% | RSI: 41.0 | % above MA200: -36.6% | Trend: Below MA20, MA50, MA200
Applovin operates a mobile app technology platform that helps developers monetize and grow their apps through targeted advertising and analytics. Investors care because its performance directly reflects mobile ad spending trends, a high-growth digital market.
Technically concerning: RSI(14) at 41.0 shows weakening momentum, with bearish MA alignment (price < MA20 < MA50 < MA200). Testing 52-week lows after -51.7% decline signals severe downtrend.
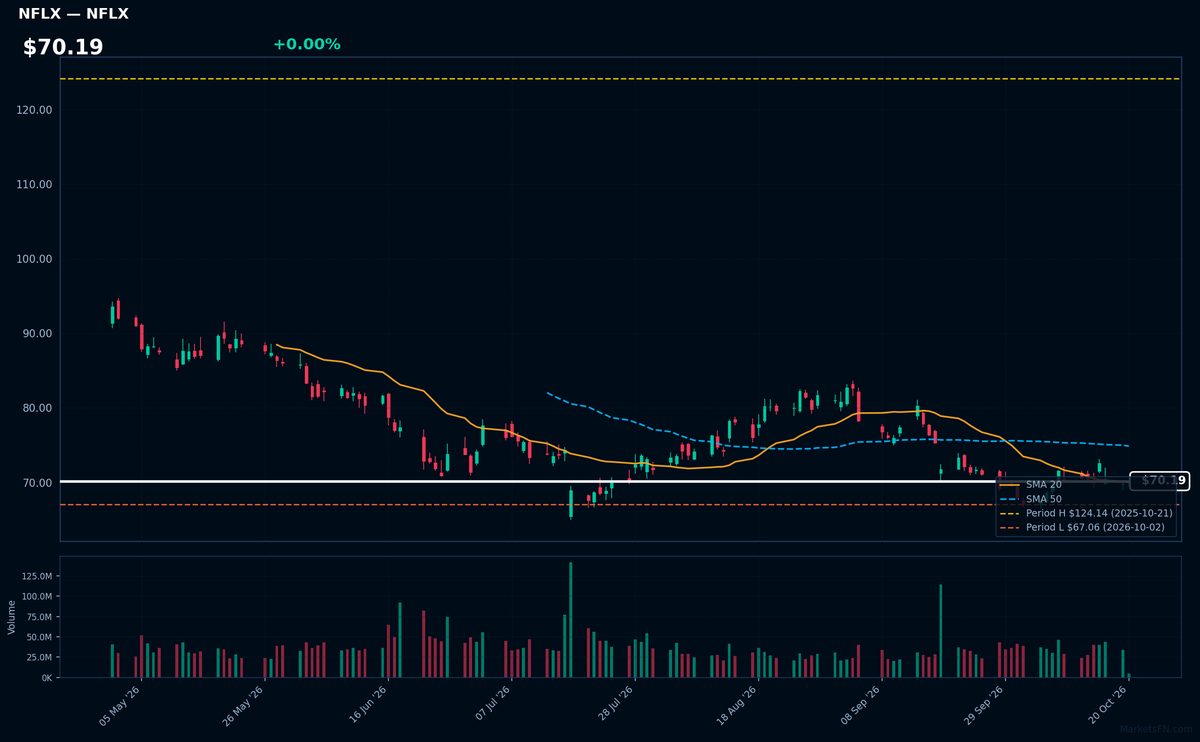
NFLX | Netflix Inc | Communication Services | Price Last: $70.19 | % Realized: -43.33% | RSI: 44.9 | % above MA200: -15.1% | Trend: Above MA20 · Below MA50, MA200
Netflix Inc dominates global streaming with 220M+ subscribers, pioneering original content while facing intensifying competition. Investors care because its pricing power and international growth potential make it a bellwether for the subscription economy's profitability amid macroeconomic pressures.
Technically concerning: RSI(14) at 44.9 shows weak momentum, trading below MA50/MA200 while hovering just 4.7% above 52-week lows (-43.3% annual return). Mixed MA alignment suggests unresolved downtrend.
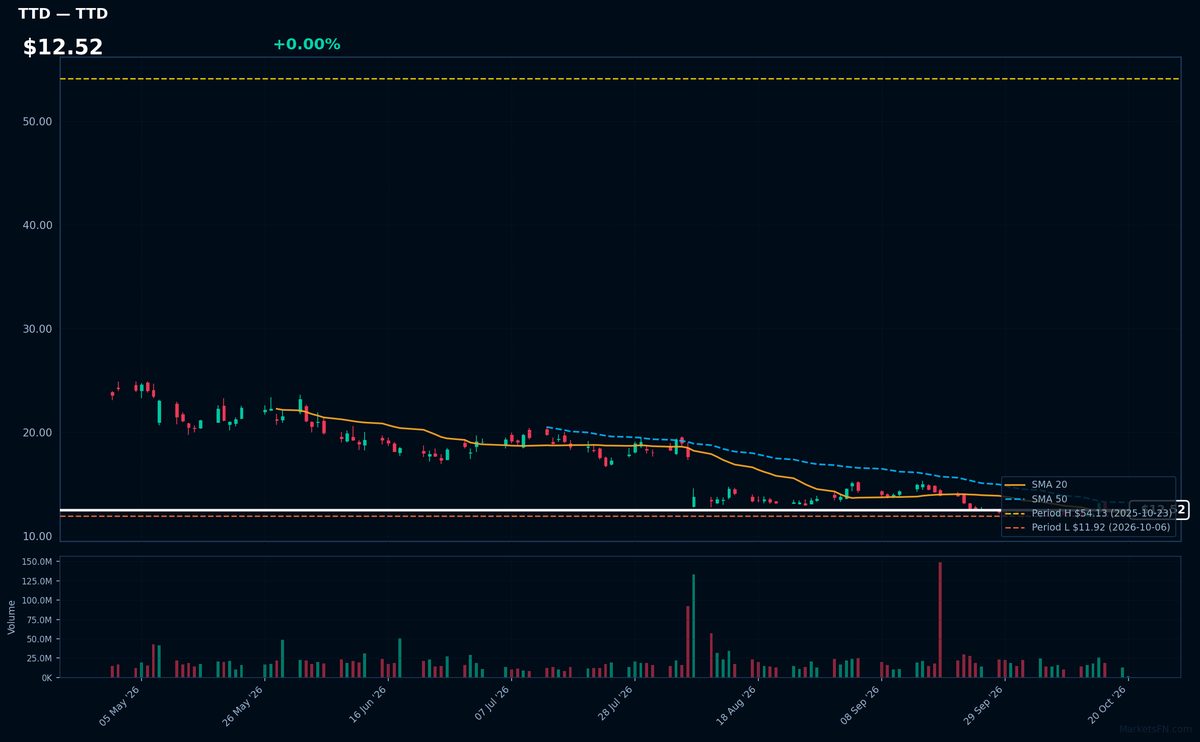
TTD | Trade Desk Inc | Communication Services | Price Last: $12.52 | % Realized: -76.16% | RSI: 46.7 | % above MA200: -40.6% | Trend: Above MA20 · Below MA50, MA200
Trade Desk operates a cloud-based platform for programmatic ad buying, enabling precise audience targeting. Investors care because its tech-driven approach captures digital ad spend shifting from traditional channels, though recent sector headwinds pressure performance.
TTD shows mixed signals: RSI 46.7 (neutral) with price above MA20 but below MA50/200. Extreme proximity to 52-week low (-76.2% return) signals severe bearish momentum, testing critical support.
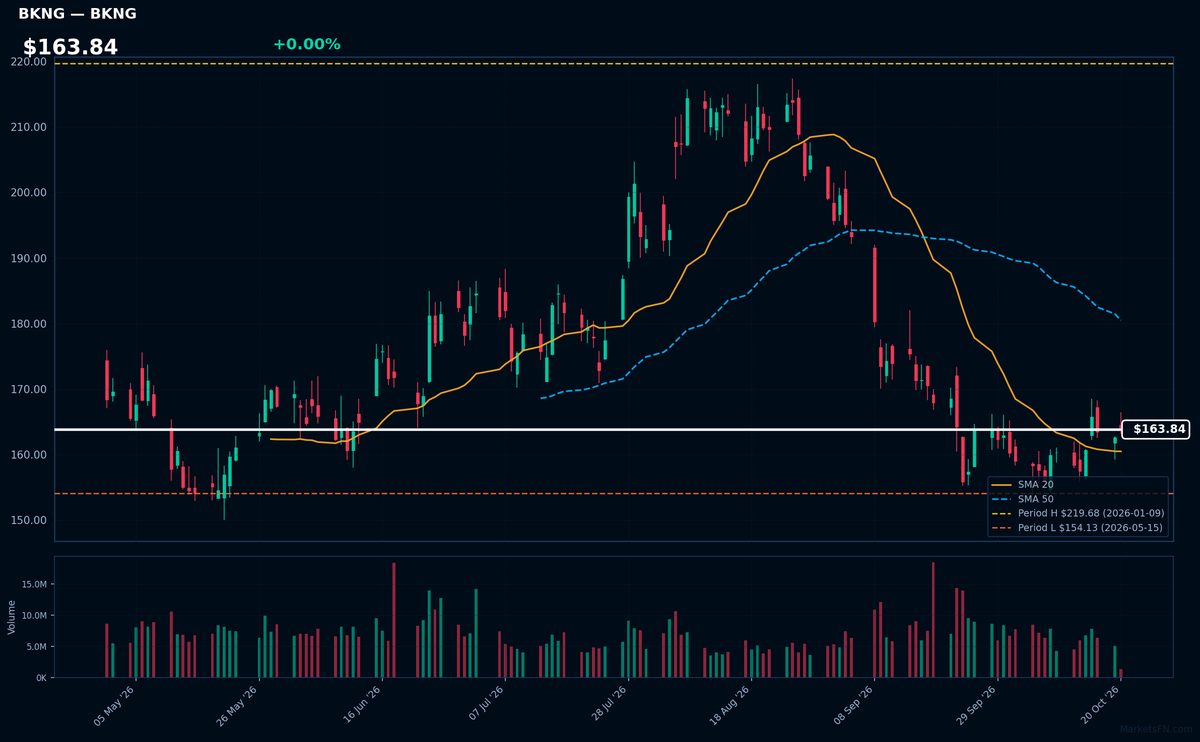
BKNG | Booking Holdings Inc | Consumer Cyclical | Price Last: $163.90 | % Realized: -20.31% | RSI: 46.1 | % above MA200: -8.6% | Trend: Above MA20 · Below MA50, MA200
Booking Holdings operates leading online travel platforms (Booking.com, Priceline, Kayak) connecting travelers with lodging/transportation globally. Investors care for its dominant market share in digital travel bookings and exposure to post-pandemic travel recovery trends.
BKNG trades at $163.84 with mixed signals: RSI(14) at 46.1 (neutral), price above MA20 but below MA50/MA200. Down 20.3% over 52 weeks and just 6.3% above 52-week lows, this reflects weak momentum and tests critical support.
Market Commentary
The clustering of Nasdaq 100 stocks at 52-week extremes reflects a bifurcated market where investor conviction is concentrated in defensive names (ADP, KDP, CCEP) and select tech outperformers (TEAM, BIIB), while growth-sensitive tech (APP, NFLX, TTD) struggles near lows. This suggests sector rotation amid macroeconomic uncertainty, with money flowing toward stable cash flows and away from high-multiple discretionary tech.
The divergence aligns with macro themes of elevated interest rates weighing on growth stocks, while resilient earnings in payroll processing (ADP), beverages (KDP, CCEP), and biotech (BIIB) attract capital. Meanwhile, ad-tech (TTD, APP) and streaming (NFLX) face cyclical pressures, and travel (BKNG) contends with slowing consumer spending. The tech sector's performance remains tied to Fed policy and earnings revisions.
Key levels to monitor include the 52-week highs for ADP, TEAM, and BIIB—a breakout could signal extended leadership. For stocks near lows (CPRT +2.0%, APP +4.2%), holding above their 52-week lows is critical; a breakdown may trigger further selling. Catalysts include upcoming earnings, inflation data, and any shifts in rate expectations that could reverse current sector trends.
Methodology: All 101 Nasdaq 100 constituents screened. 52-week high = highest daily close over the past 252 trading days (approx. 1 year). 52-week low = lowest daily close over the same period. Distance = (current price / extreme − 1) × 100. Technical indicators computed on up to 1 year of daily OHLCV data.
Disclaimer: For informational purposes only. Not investment advice. Past performance is not indicative of future results.