S&P 500 2026 YTD Highs & Lows Radar: Microsoftoration (MSFT), McDonald's (MCD) and more
MarketsFN Team

S&P 500 2026 YTD Highs & Lows Radar: Microsoftoration (MSFT), McDonald's (MCD) and more
Screening all 503 S&P 500 constituents for stocks nearest to their 2026 year-to-date high and their 2026 YTD low. Data as of September 28, 2026. % Realized = total return since Jan 1 2026.
Legend: RSI > 70 = overbought · RSI < 30 = oversold · Green % Realized = positive YTD return · Red = negative.
📈 Nearest to 2026 High
Sectors represented: Technology (3), Communication Services (1), Healthcare (1)
| Ticker | Company | Sector | Price Last | % Realized | 2026 YTD High Date | RSI | % above MA200 | Trend |
|---|---|---|---|---|---|---|---|---|
| MSFT | Microsoft Corporation | Technology | $516.17 | +9.14% | 2026-09-25 | 55.2 | +19.5% | Above MA20, MA50, MA200 |
| AAPL | Apple Inc | Technology | $341.07 | +25.85% | 2026-09-25 | 66.2 | +18.4% | Above MA20, MA50, MA200 |
| AMD | Advanced Micro Devices Inc | Technology | $630.63 | +182.20% | 2026-09-25 | 68.8 | +72.0% | Above MA20, MA50, MA200 |
| WBD | Warner Bros. Discovery Inc | Communication Services | $30.86 | +8.24% | 2026-09-25 | 75.1 | +11.6% | Above MA20, MA50, MA200 |
| BIIB | Biogen Inc | Healthcare | $227.60 | +27.99% | 2026-09-25 | 62.1 | +17.2% | Above MA20, MA50, MA200 |
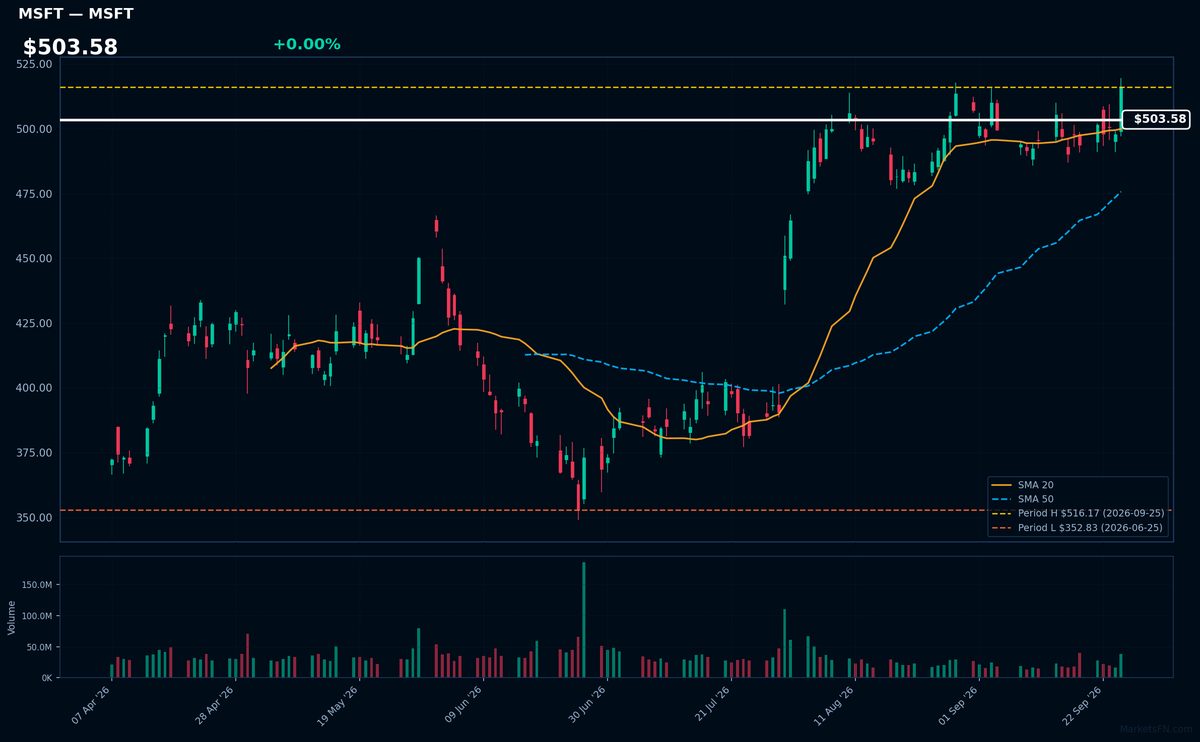
MSFT | Microsoft Corporation | Technology | Price Last: $516.17 | % Realized: +9.14% | RSI: 55.2 | % above MA200: +19.5% | Trend: Above MA20, MA50, MA200
Microsoft Corporation is a technology company that develops, licenses, and supports software, hardware, and services, including Windows, Office, Azure, and Xbox. Investors care about its dominance in productivity software and cloud computing, driving growth and profitability.
Microsoft's current technical situation indicates sustained uptrend with bullish MA alignment (price > MA20 > MA50 > MA200) and RSI(14) at 55.2, suggesting momentum. The stock is near its 2026 YTD high, 0.0% below, indicating potential breakout level.
Related headlines
- Microsoft Rolls Out Refreshed Copilot App as Stock Lags Megacap Peers
- Microsoft's Gates Says AI Needs Regulation
- Microsoft Copilot Is Turning Into An AI Operating System Heres What It Means For MSFT Stock, According To Oppenheimers Brian Schwartz
- S&P 500, Dow, Nasdaq End Week Higher On Chipmaker Strength, Easing Oil Amid Signs Of Easing US-Iran Conflict META, COST, MSFT, CRWD, SKHY In Focus
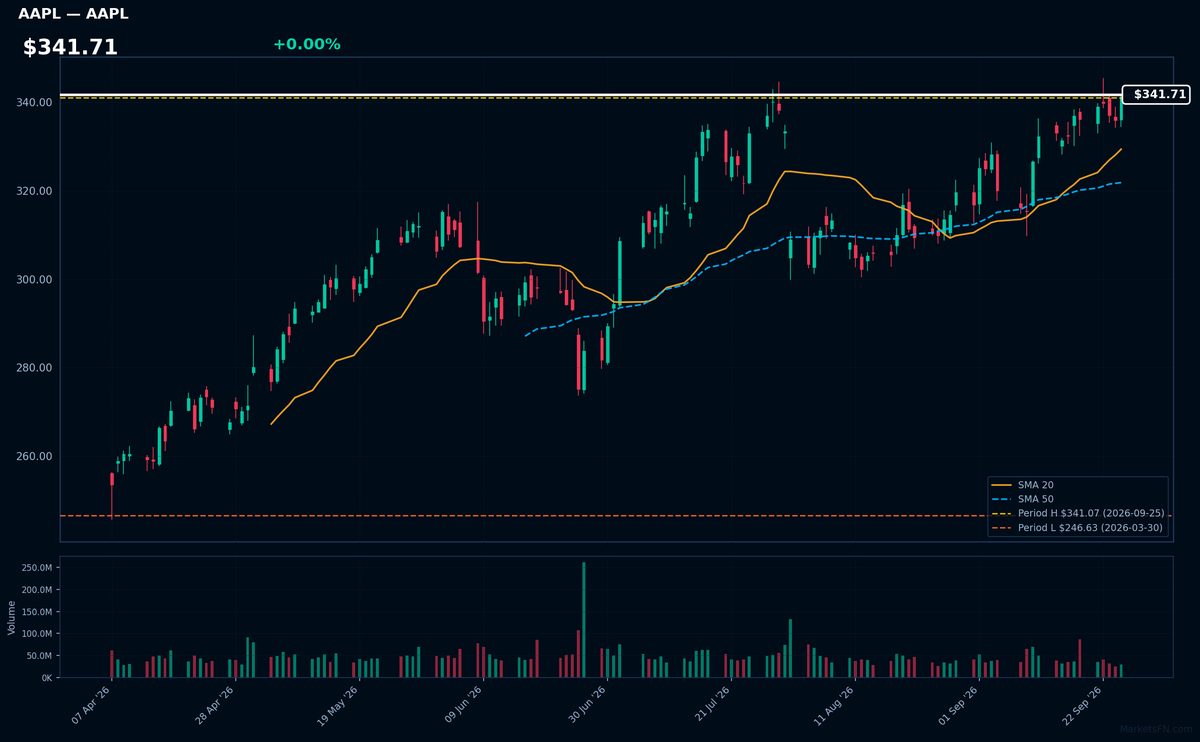
AAPL | Apple Inc | Technology | Price Last: $341.07 | % Realized: +25.85% | RSI: 66.2 | % above MA200: +18.4% | Trend: Above MA20, MA50, MA200
Apple Inc designs, manufactures, and markets consumer electronics, software, and services. Investors should care about its innovative product ecosystem, services growth, and profitability. Its ability to maintain premium pricing and expand into new markets like wearables and services is crucial.
AAPL is in a sustained uptrend with price > MA20 > MA50 > MA200. RSI(14) is 66.2, indicating strong momentum. The stock is 0.0% below its 2026 YTD high, suggesting a potential breakout. The 25.9% 2026 YTD return reinforces the bullish technical picture.
Related headlines
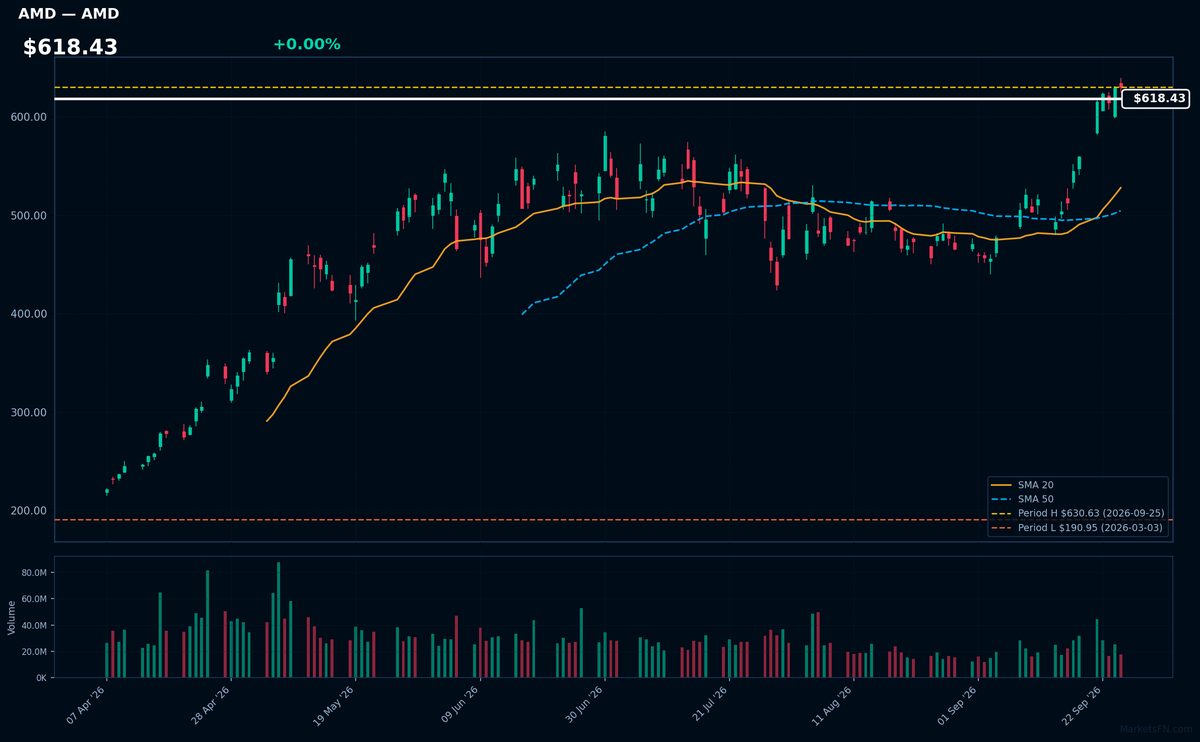
AMD | Advanced Micro Devices Inc | Technology | Price Last: $630.63 | % Realized: +182.20% | RSI: 68.8 | % above MA200: +72.0% | Trend: Above MA20, MA50, MA200
Advanced Micro Devices Inc (AMD) is a semiconductor company designing and manufacturing high-performance CPUs, GPUs, and other processing technologies for gaming, data centers, and AI applications, making it a key player in the rapidly evolving tech landscape.
AMD's current technical situation indicates strong momentum: RSI(14) is 68.8, and the stock exhibits a bullish MA alignment with price > MA20 > MA50 > MA200, near a potential breakout at its 2026 YTD high.
Related headlines
- INTC, AMD, AVGO: Chip Stocks Lead Slide As Tech Gets Hammered Amid Renewed U.S.-Iran Tensions
- Why Did AMD, HPE, MRNA Stocks Surge To 52-Week Highs Last Week?
- AMD Just Hit $1 Trillion After A Blistering 194% Surge YTD Beth Kindig Says The Dark Horse Still Has Room To Run
- Bank of America Sees AMD at $720 on CPU Demand. Anthropics $11.6 Billion Akamai Deal Is Part of Why
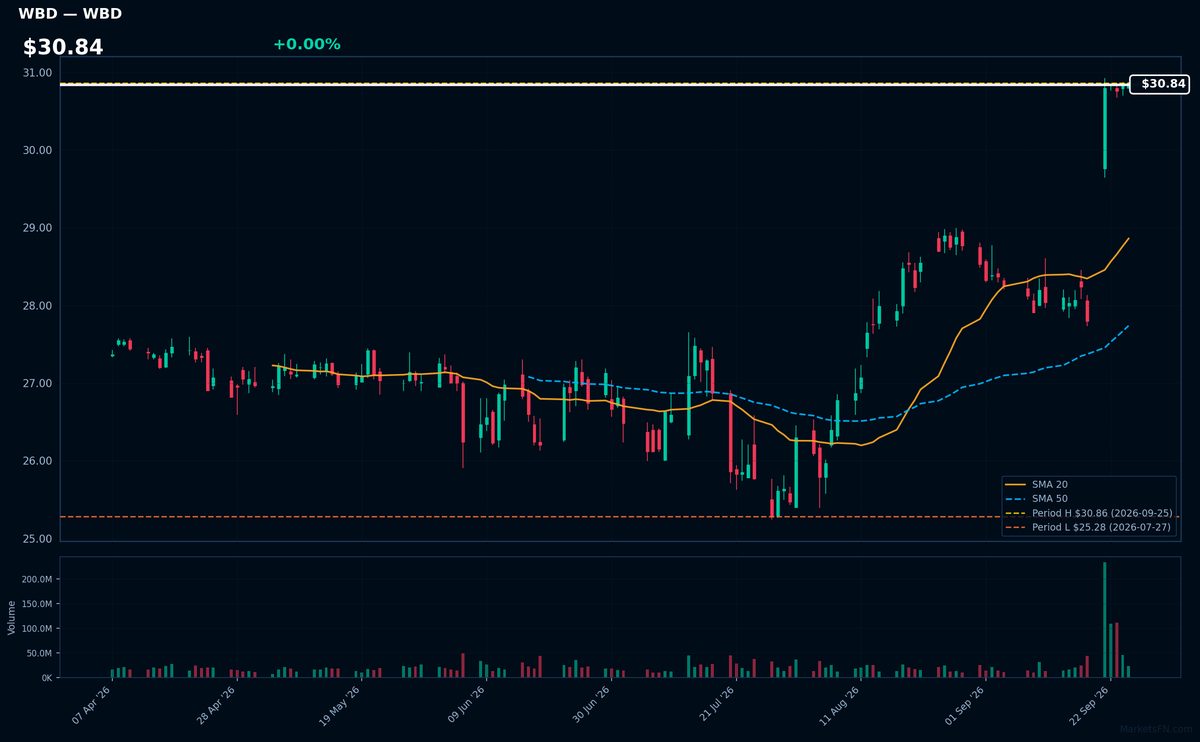
WBD | Warner Bros. Discovery Inc | Communication Services | Price Last: $30.86 | % Realized: +8.24% | RSI: 75.1 | % above MA200: +11.6% | Trend: Above MA20, MA50, MA200
Warner Bros. Discovery Inc is a media conglomerate with a diverse portfolio of television networks, film studios, and streaming services, including HBO, Warner Bros., and Discovery+. Investors should care due to its significant influence on global entertainment and media trends.
Warner Bros. Discovery Inc is near a potential breakout at $30.84, with RSI(14) at 75.1 indicating strong momentum. The bullish MA alignment (price > MA20 > MA50 > MA200) confirms a sustained uptrend, with the stock 0.0% below its 2026 YTD high.
Related headlines
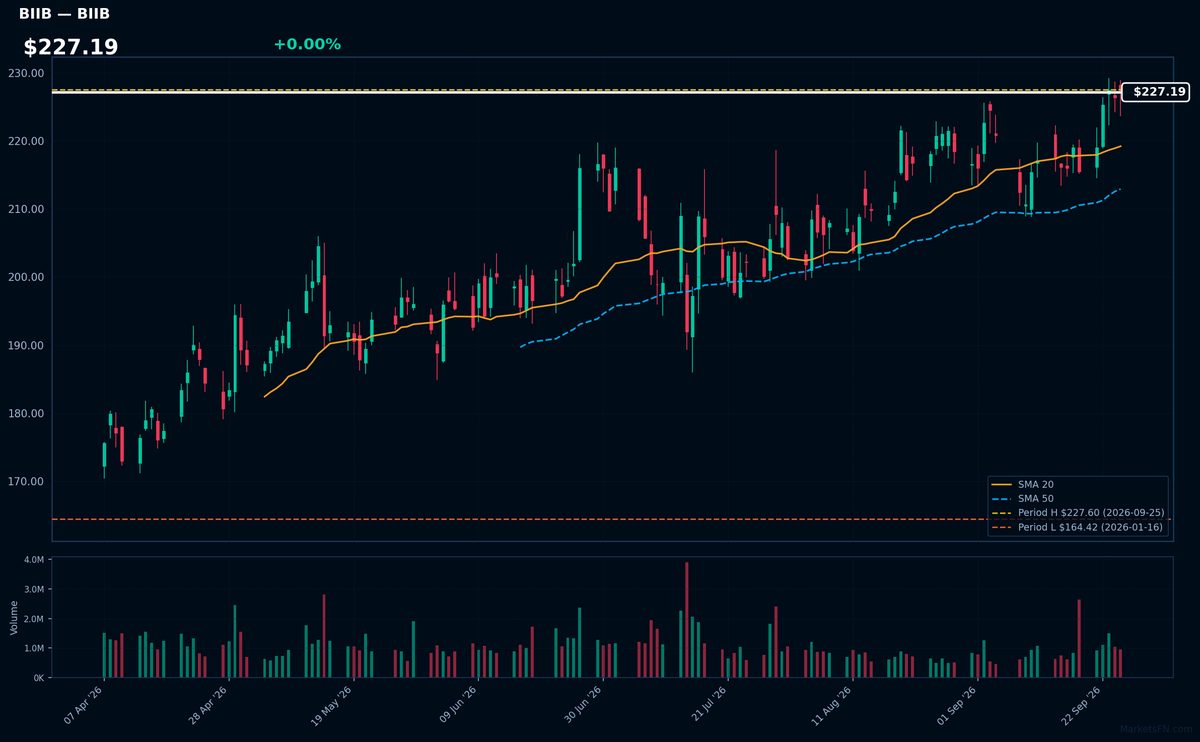
BIIB | Biogen Inc | Healthcare | Price Last: $227.60 | % Realized: +27.99% | RSI: 62.1 | % above MA200: +17.2% | Trend: Above MA20, MA50, MA200
Biogen Inc is a biotechnology company that develops treatments for neurological and neurodegenerative diseases. Investors should care because its therapies for conditions like multiple sclerosis have significant market potential and the company's pipeline impacts its growth prospects.
Biogen Inc's current technical situation indicates sustained uptrend momentum with price at $227.19, RSI(14) at 62.1, and bullish MA alignment (price > MA20 > MA50 > MA200). The stock is near its 2026 YTD high, up 28.0% YTD, suggesting potential for further breakout.
Related headlines
- Stoke Therapeutics and Biogen Present Long-Term Clinical Data that Support the Disease-Modifying Potential of Zorevunersen, an Investigational Medicine for the Treatment of Dravet Syndrome, at the 16th European Epilepsy Congress (EEC)
- Stoke Therapeutics and Biogen to present four-year zorevunersen data at epilepsy congress
- Stoke Therapeutics and Biogen Announce Presentations of Clinical Data from Studies of Zorevunersen, an Investigational Medicine for the Treatment of Dravet Syndrome, at the 16th European Epilepsy Congress (EEC)
- Wolfe Research upgrades Biogen, AbbVie on pipeline strength and valuation
📉 Nearest to 2026 Low
Sectors represented: Industrials (2), Consumer Cyclical (1), Communication Services (1), Utilities (1)
| Ticker | Company | Sector | Price Last | % Realized | 2026 YTD Low Date | RSI | % above MA200 | Trend |
|---|---|---|---|---|---|---|---|---|
| MCD | McDonald's Corp | Consumer Cyclical | $236.50 | -22.01% | 2026-09-25 | 24.1 | -18.9% | Below MA20, MA50, MA200 |
| CMCSA | Comcast Corp | Communication Services | $21.91 | -20.86% | 2026-09-25 | 25.9 | -18.2% | Below MA20, MA50, MA200 |
| SO | Southern Company | Utilities | $82.88 | -4.93% | 2026-09-25 | 20.3 | -10.1% | Below MA20, MA50, MA200 |
| WM | Waste Management, Inc | Industrials | $206.83 | -5.30% | 2026-09-25 | 29.1 | -8.1% | Below MA20, MA50, MA200 |
| LHX | L3Harris Technologies Inc | Industrials | $237.69 | -21.94% | 2026-09-25 | 21.8 | -23.7% | Below MA20, MA50, MA200 |
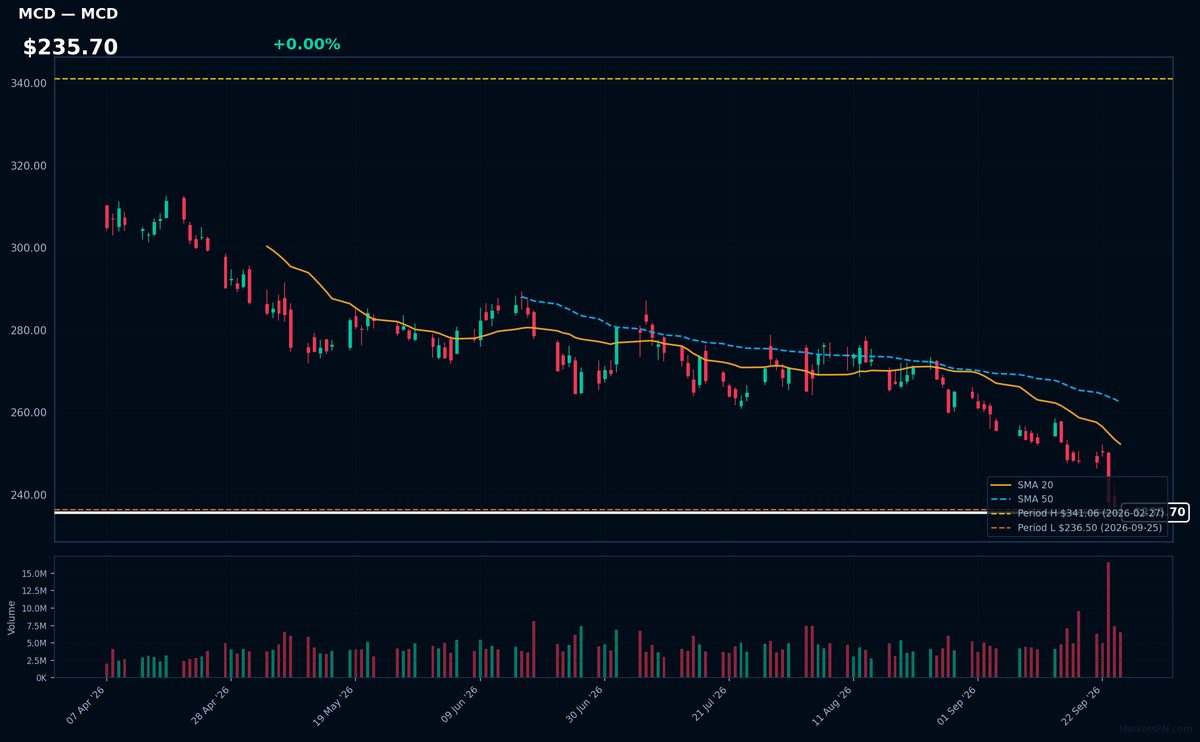
MCD | McDonald's Corp | Consumer Cyclical | Price Last: $236.50 | % Realized: -22.01% | RSI: 24.1 | % above MA200: -18.9% | Trend: Below MA20, MA50, MA200
McDonald's Corp operates a global fast-food chain, serving burgers, fries, and beverages. Investors care about its brand strength, operational efficiency, and market penetration, as these factors influence revenue growth and profitability.
McDonald's Corp is in a sustained downtrend with price ($235.70) below MA20, MA50, and MA200. The RSI(14) is 24.1, near oversold territory, and the stock is testing its 2026 YTD low, a potential warning sign.
Related headlines
- McDonald's New Investment Plan Signals Long-Term Growth-and a Short-Term Reality Check
- McDonalds Sell-Off Hits 30% as Big Mac Inflation Spurs Pushback
- McDonalds CEO says high inflation will last many more years but theres a McLimit to how much people will tolerate
- How McDonalds plans to reactivate 150M infrequent loyalty guests
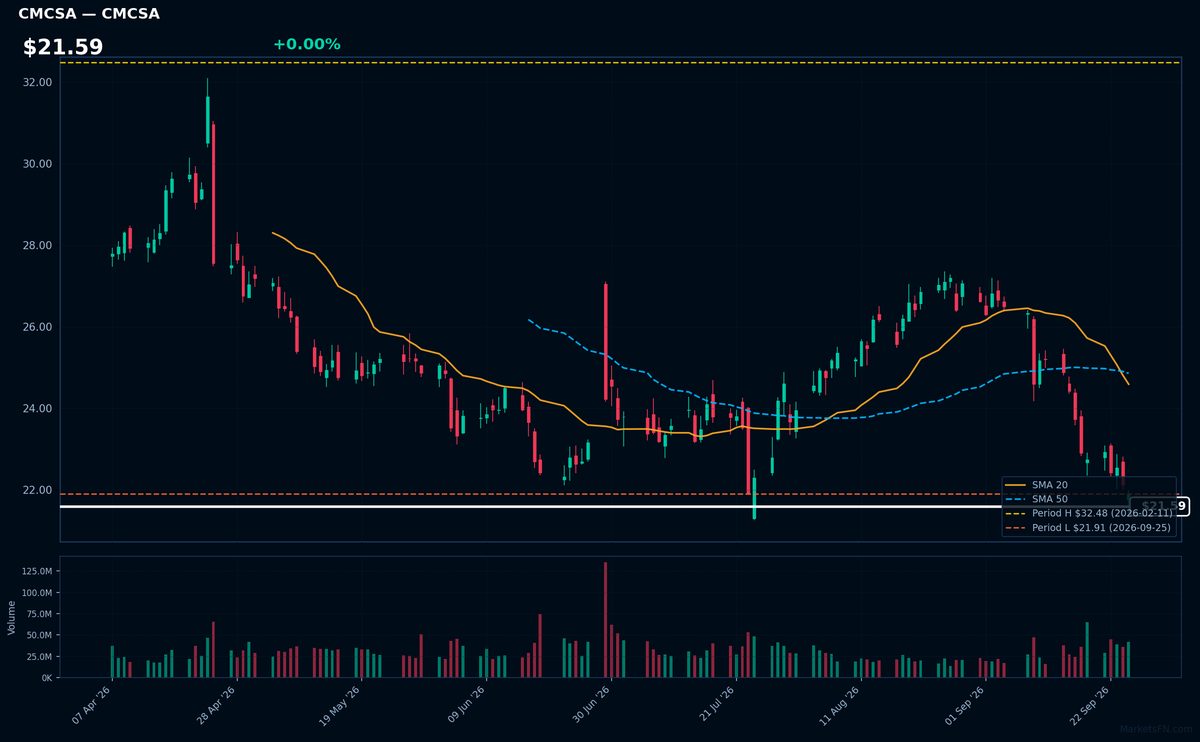
CMCSA | Comcast Corp | Communication Services | Price Last: $21.91 | % Realized: -20.86% | RSI: 25.9 | % above MA200: -18.2% | Trend: Below MA20, MA50, MA200
Comcast Corp is a media and telecommunications conglomerate providing cable television, internet, and phone services, as well as owning NBCUniversal, a major media company with film, television, and theme park assets, making it a significant player in both consumer connectivity and entertainment content.
Comcast Corp's current technical situation indicates a warning sign with an RSI(14) of 25.9, suggesting oversold conditions, and a bearish MA alignment (price < MA20 < MA50 < MA200), confirming a sustained downtrend, with the stock testing major support at its 2026 YTD low.
Related headlines
- Comcast Completes Washington County, Pennsylvania Expansion Connecting Thousands to High-Speed Internet for the First Time
- KeyBanc Revamps Comcast Stock Price Target for Rest of 2026
- KeyBanc gets bearish on Comcast as broadband competition intensifies
- Comcast Stock Is Downgraded to Sell. Why the Trouble Runs Deep.
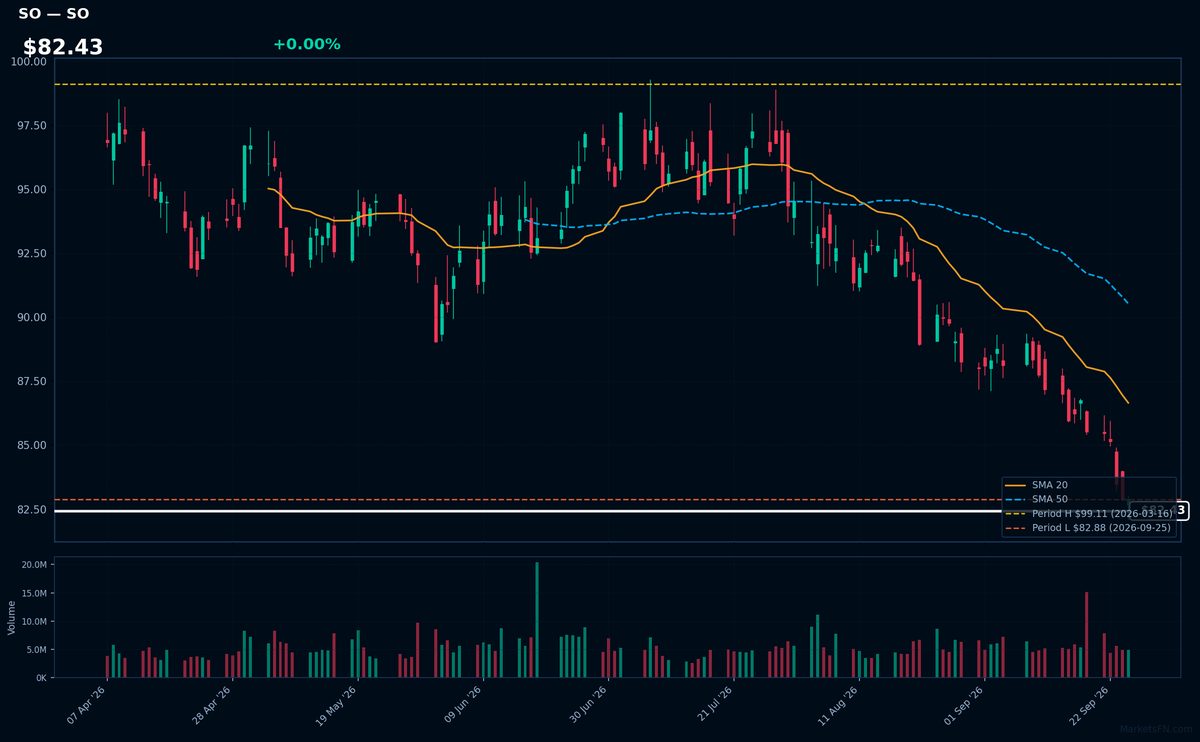
SO | Southern Company | Utilities | Price Last: $82.88 | % Realized: -4.93% | RSI: 20.3 | % above MA200: -10.1% | Trend: Below MA20, MA50, MA200
Southern Company is a large utility holding company providing electricity and natural gas to a significant customer base, making it an essential service provider with relatively stable demand; investors care about its steady income and dividend yield.
Southern Company's technicals indicate a sustained downtrend with price ($82.43) below MA20, MA50, and MA200; RSI(14) at 20.3 suggests oversold conditions, and being 0.0% above its 2026 YTD low signals major support testing, potentially a warning sign.
Related headlines
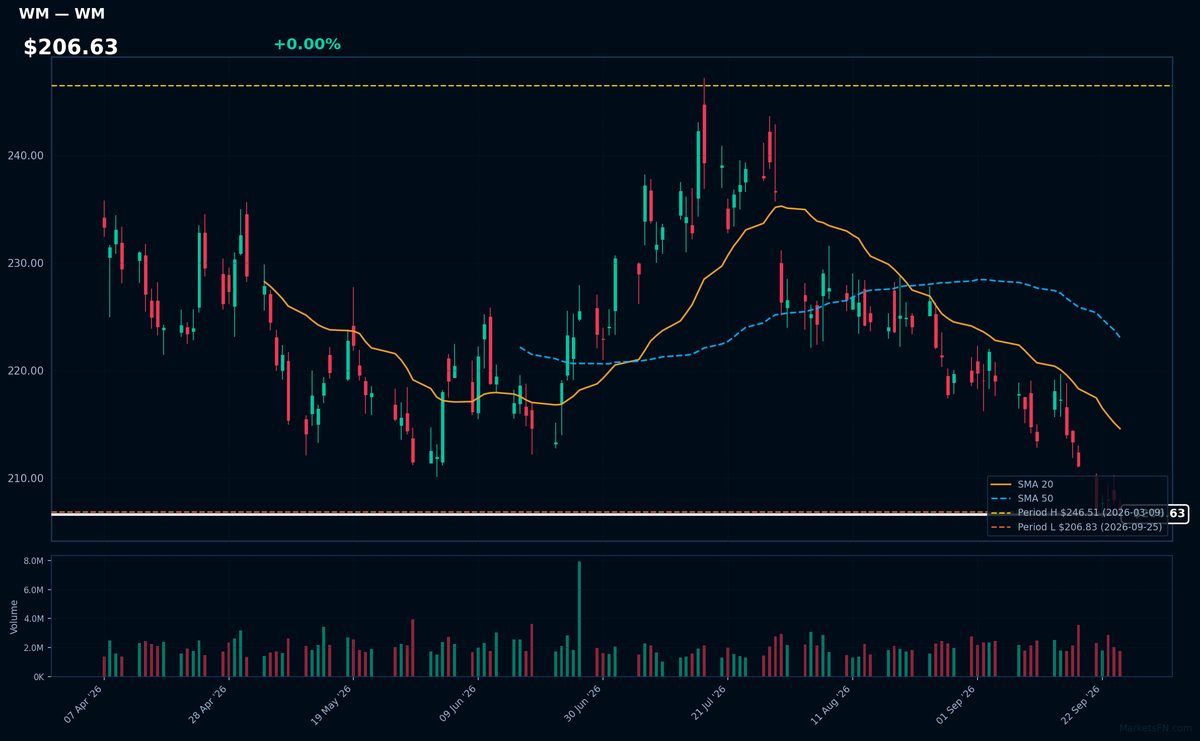
WM | Waste Management, Inc | Industrials | Price Last: $206.83 | % Realized: -5.30% | RSI: 29.1 | % above MA200: -8.1% | Trend: Below MA20, MA50, MA200
Waste Management, Inc provides comprehensive waste management services including collection, transfer, recycling, and disposal. Investors should care as the company's operational efficiency and waste management infrastructure impact its profitability and ability to navigate regulatory environments.
Waste Management, Inc's current technical situation is bearish, with an RSI(14) of 29.1 indicating oversold conditions and a sustained downtrend as price ($206.63) remains below MA20, MA50, and MA200, testing major support at its 2026 YTD low.
Related headlines
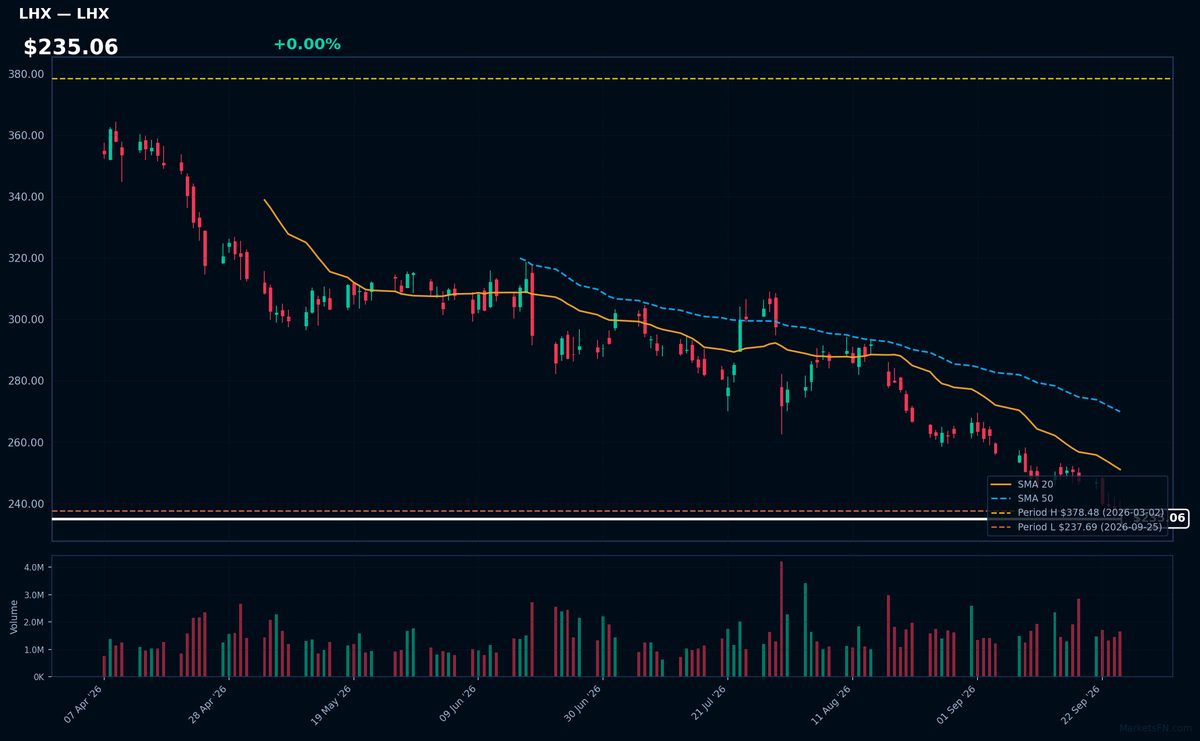
LHX | L3Harris Technologies Inc | Industrials | Price Last: $237.69 | % Realized: -21.94% | RSI: 21.8 | % above MA200: -23.7% | Trend: Below MA20, MA50, MA200
L3Harris Technologies Inc is a defense technology company providing advanced defense and commercial technologies across air, land, sea, space, and cyber domains. Investors should care due to its significant role in the defense industry and potential impact from geopolitical tensions and defense spending.
L3Harris is in a sustained downtrend with price ($235.06) below MA20, MA50, and MA200. The RSI(14) is 21.8, indicating oversold conditions. The stock is testing major support at its 2026 YTD low, having returned -21.9% YTD, potentially a warning sign for further downside.
Related headlines
Market Commentary
The S&P 500 stocks listed are near their 2026 year-to-date (YTD) extremes, with some at their highs and others at their lows. Specifically, MSFT, AAPL, AMD, WBD, and BIIB are at their 2026 YTD highs, while MCD, CMCSA, SO, WM, and LHX are at their 2026 YTD lows.
The stocks near their 2026 YTD highs are from the technology and healthcare sectors, indicating strong performance in these areas. In contrast, the stocks at their 2026 YTD lows are from consumer staples, utilities, and industrials, suggesting weaker performance in these sectors. This divergence may be driven by market conditions and sector-specific themes, such as the ongoing demand for technology and healthcare innovation.
Investors should monitor the factors driving these extremes, including earnings reports, industry trends, and macroeconomic conditions. As the year progresses, changes in these stocks' positions relative to their YTD extremes may signal shifts in market sentiment and sector rotation. Watching these developments can provide insights into potential investment opportunities and risks.
Methodology: All 503 S&P 500 constituents screened. Close prices downloaded from 2026-01-01. Period high = highest close since Jan 1 2026; period low = lowest close since Jan 1 2026. Distance = (current price / period extreme − 1) × 100. Technical indicators computed on up to 1 year of daily OHLCV data.
Disclaimer: For informational purposes only. Not investment advice. Past performance is not indicative of future results.