Market-wide short ratio hits 50.3% as SOAR and EARI lead bearish charge
MarketsFN Data Team
Regulation SHO, adopted by the SEC in 2004, requires broker-dealers to report all short sale transactions to FINRA each trading day. It was designed to address abusive short-selling practices including naked short selling (selling shares without first borrowing them). FINRA aggregates these reports and publishes daily short volume data per security, broken down by reporting facility and market centre.
The short sale ratio is short volume divided by total reported volume for a given day. A ratio of 40–45% is typical across the market — even in neutral conditions, a significant portion of trades involve short selling (arbitrage, hedging, ETF creation). A ratio above 50% is elevated. Above 60% suggests concentrated bearish pressure or heavy institutional shorting in that name.
Some short sales are marked "exempt" — these include market-maker hedging activity, ETF arbitrage, and bona-fide hedging transactions. Exempt sales are technically short sales but are not directional bearish bets. A stock with a high exempt ratio relative to its short ratio is likely seeing heavy ETF or market-making activity rather than speculative shorting. They are tracked separately in this report.
Reg SHO data covers only FINRA-reported volume, not the full exchange order book. A single day's data is noisy — a high short ratio on one day may reflect a single large block trade. For reliable signals, watch for multiple consecutive days of elevated ratios in the same stock, and cross-reference with consolidated short interest (bi-monthly) to confirm whether short positions are actually building up. Data is typically released same-day or T+1.
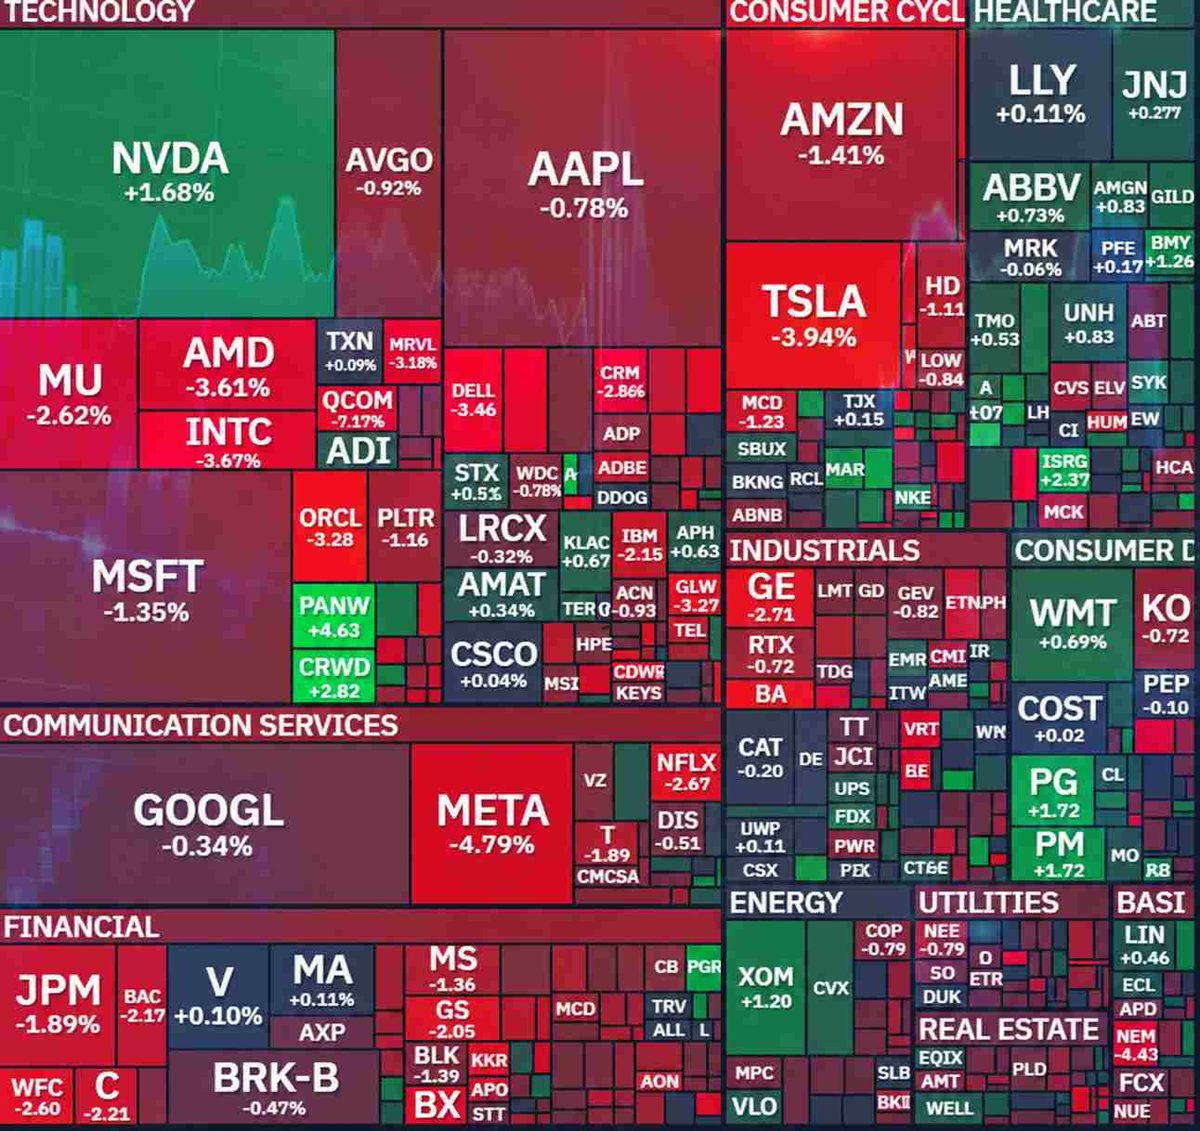
US markets saw elevated bearish sentiment with a 50.3% short ratio, above the typical 40-45% baseline, while SOAR's 279M short volume and EARI's 72.9% ratio stood out as most aggressive bets.
Today's session showed heightened short-selling activity with 4.90B shares sold short out of 9.74B total volume, pushing the market-wide short ratio to 50.3% — significantly above the historical 40-45% baseline. Extreme bearishness appeared in 1,209 stocks with ratios exceeding 50%, including 636 above 60%, suggesting widespread intraday pessimism across equities.
NXGB dominated absolute short volume with 360.8M shares, typical for large liquid OTC stocks, while AURI showed perfect 100% short ratio among high-volume names. EARI emerged as the most concerning signal, appearing in both lists with 148.9M short volume and a 72.9% ratio — extreme bearish conviction in a single name.
Top 20 by Short Volume
| Ticker | Short Volume | Total Volume | Short Ratio | Exempt Short |
|---|---|---|---|---|
| 1. NXGB | 360.8M | 885.7M | 40.7% | 0 |
| 2. SOAR | 279.3M | 471.2M | 59.3% | 2.4M |
| 3. ECGI | 186.8M | 307.6M | 60.7% | 0 |
| 4. EARI | 148.9M | 204.3M | 72.9% | 0 |
| 5. RWAX | 105.9M | 239.6M | 44.2% | 0 |
| 6. CYBL | 97.2M | 204.0M | 47.7% | 0 |
| 7. KNRX | 90.8M | 175.3M | 51.8% | 639,029 |
| 8. ARAY | 77.9M | 139.1M | 56.0% | 996,541 |
| 9. AGYP | 68.8M | 86.1M | 79.8% | 0 |
| 10. TIPS | 59.3M | 152.5M | 38.9% | 0 |
| 11. UMAV | 39.3M | 69.1M | 56.9% | 0 |
| 12. NU | 38.7M | 77.2M | 50.1% | 406,303 |
| 13. AEFI | 38.1M | 110.2M | 34.5% | 0 |
| 14. BDPT | 32.8M | 57.9M | 56.6% | 0 |
| 15. GGSM | 29.7M | 31.6M | 94.2% | 0 |
| 16. KNDI | 29.3M | 53.8M | 54.5% | 267,437 |
| 17. NVD | 29.2M | 56.5M | 51.7% | 219,266 |
| 18. HYG | 23.7M | 43.3M | 54.8% | 363 |
| 19. PLUG | 23.3M | 39.5M | 58.9% | 82,303 |
| 20. INTC | 22.8M | 49.2M | 46.4% | 141,694 |
No notable short-exempt activity appeared among top shorted stocks today, confirming that nearly all reported short volume reflects directional bearish bets rather than market-maker hedging or arbitrage activity, which would require separate interpretation as non-speculative trades.

Top 20 by Short Ratio (high-volume stocks ≥ 2M shares)
| Ticker | Short Ratio | Short Volume | Total Volume | Market |
|---|---|---|---|---|
| 1. BMXC | 100.0% | 4.0M | 4.0M | OTC |
| 2. AURI | 100.0% | 10.8M | 10.8M | OTC |
| 3. SOBO | 100.0% | 3.0M | 3.0M | NYSE |
| 4. TRP | 97.2% | 8.3M | 8.6M | NYSE, Nasdaq |
| 5. VNTN | 95.4% | 4.2M | 4.4M | OTC |
| 6. GBUX | 95.4% | 2.9M | 3.1M | OTC |
| 7. NBND | 95.1% | 2.5M | 2.6M | OTC |
| 8. GGSM | 94.2% | 29.7M | 31.6M | OTC |
| 9. ITOX | 89.8% | 7.3M | 8.1M | OTC |
| 10. HIRU | 88.2% | 10.3M | 11.7M | OTC |
| 11. CORO | 86.0% | 2.8M | 3.2M | Nasdaq |
| 12. XLRE | 84.9% | 3.6M | 4.3M | Nasdaq |
| 13. EMED | 84.8% | 15.3M | 18.1M | OTC |
| 14. VNTH | 84.7% | 19.5M | 23.0M | OTC |
| 15. TLH | 83.8% | 2.5M | 3.0M | Nasdaq |
| 16. NTR | 83.5% | 2.3M | 2.7M | NYSE, Nasdaq |
| 17. PAAA | 83.5% | 2.3M | 2.8M | Nasdaq |
| 18. MDLN | 83.2% | 2.3M | 2.8M | NYSE, Nasdaq |
| 19. USIG | 82.0% | 1.7M | 2.1M | Nasdaq |
| 20. SHY | 80.8% | 5.0M | 6.2M | Nasdaq |
Today's aggressive shorting, particularly in names like EARI and SOAR, risks triggering short-covering rallies if positive catalysts emerge. The broad-based bearishness suggests macro concerns may be driving sentiment ahead of Friday's PCE inflation data, with OTC stocks bearing the brunt of speculative pressure.