S&P 500 2026 YTD Highs & Lows Radar: Exxon Mobil (XOM), T-Mobile US (TMUS) and more
MarketsFN Team

Screening all 503 S&P 500 constituents for stocks nearest to their 2026 year-to-date high and their 2026 YTD low. Data as of October 26, 2026. % Realized = total return since Jan 1 2026.
Legend: RSI > 70 = overbought · RSI < 30 = oversold · Green % Realized = positive YTD return · Red = negative.
📈 Nearest to 2026 High
Sectors represented: Energy (3), Technology (1), Industrials (1)
| Ticker | Company | Sector | Price Last | % Realized | 2026 YTD High Date | RSI | % above MA200 | Trend |
|---|---|---|---|---|---|---|---|---|
| XOM | Exxon Mobil Corp | Energy | $183.21 | +49.38% | 2026-10-23 | 73.6 | +19.4% | Above MA20, MA50, MA200 |
| CVX | Chevron Corp | Energy | $233.21 | +49.59% | 2026-10-23 | 72.8 | +21.5% | Above MA20, MA50, MA200 |
| NOW | ServiceNow Inc | Technology | $158.96 | +7.81% | 2026-10-23 | 68.2 | +38.0% | Above MA20, MA50, MA200 |
| COP | Conoco Phillips | Energy | $150.80 | +55.95% | 2026-10-23 | 73.3 | +25.4% | Above MA20, MA50, MA200 |
| CTAS | Cintas Corporation | Industrials | $224.10 | +21.21% | 2026-10-23 | 79.3 | +18.1% | Above MA20, MA50, MA200 |
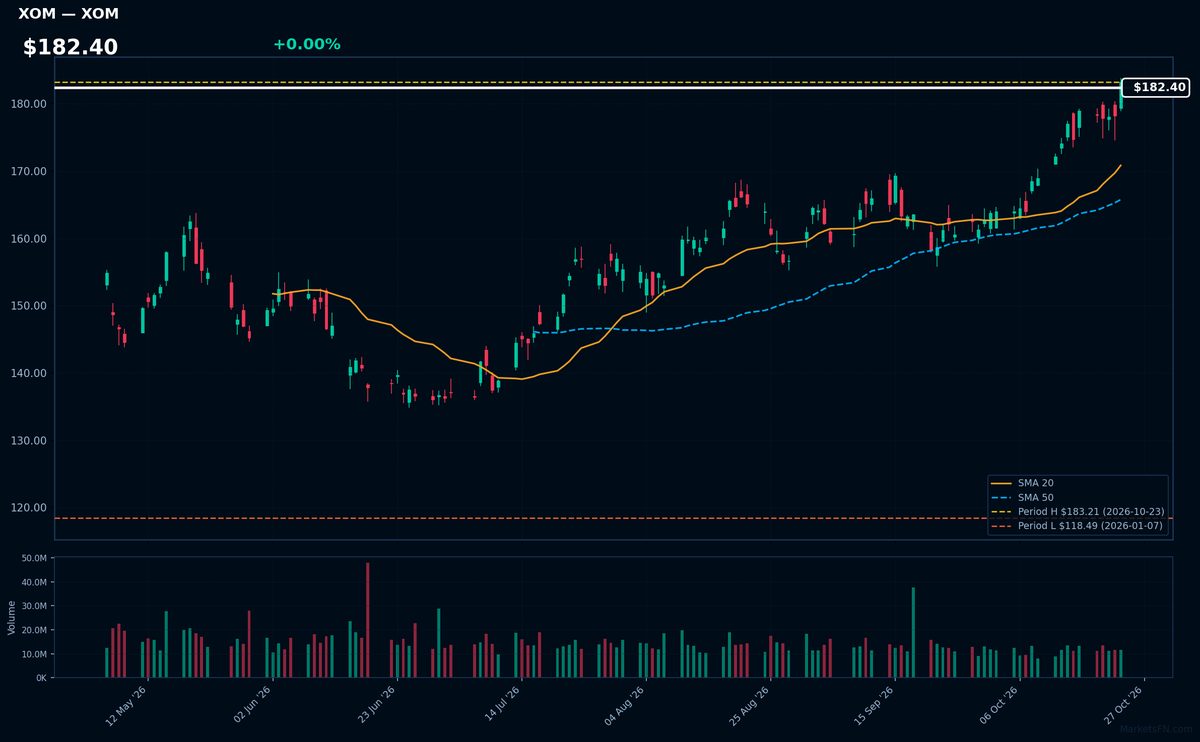
XOM | Exxon Mobil Corp | Energy | Price Last: $183.21 | % Realized: +49.38% | RSI: 73.6 | % above MA200: +19.4% | Trend: Above MA20, MA50, MA200
Exxon Mobil Corp (XOM) is an integrated energy giant producing oil, natural gas, and petrochemicals. Investors watch it for direct exposure to commodity prices, refining margins, and its 8.1% free cash flow yield — critical as energy demand grows and OPEC+ supply constraints persist.
XOM shows extreme bullish momentum: RSI(14) at 73.6 signals overbought conditions, while its price > MA20 > MA50 > MA200 confirms a sustained uptrend. The stock sits 0.0% below its 2026 YTD high after gaining 49.4% — a potential breakout or warning sign given stretched valuations.
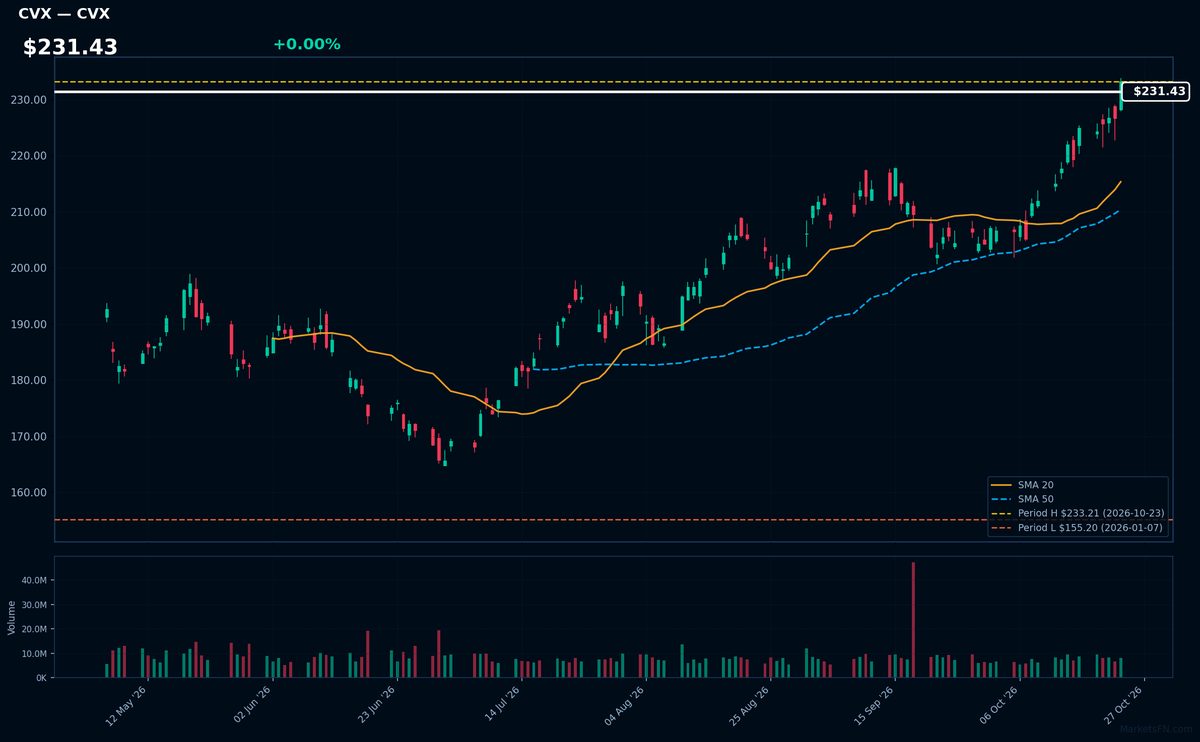
CVX | Chevron Corp | Energy | Price Last: $233.21 | % Realized: +49.59% | RSI: 72.8 | % above MA200: +21.5% | Trend: Above MA20, MA50, MA200
Chevron Corp (CVX) is an integrated energy major with upstream oil/gas production and downstream refining/marketing operations. Investors care for its global scale, dividend reliability, and exposure to both commodity prices and refining margins.
Technically bullish with RSI(14) at 72.8 (overbought) and price > MA20 > MA50 > MA200. At YTD highs (+49.6% in 2026), testing breakout levels. Momentum extreme warrants caution despite trend alignment.
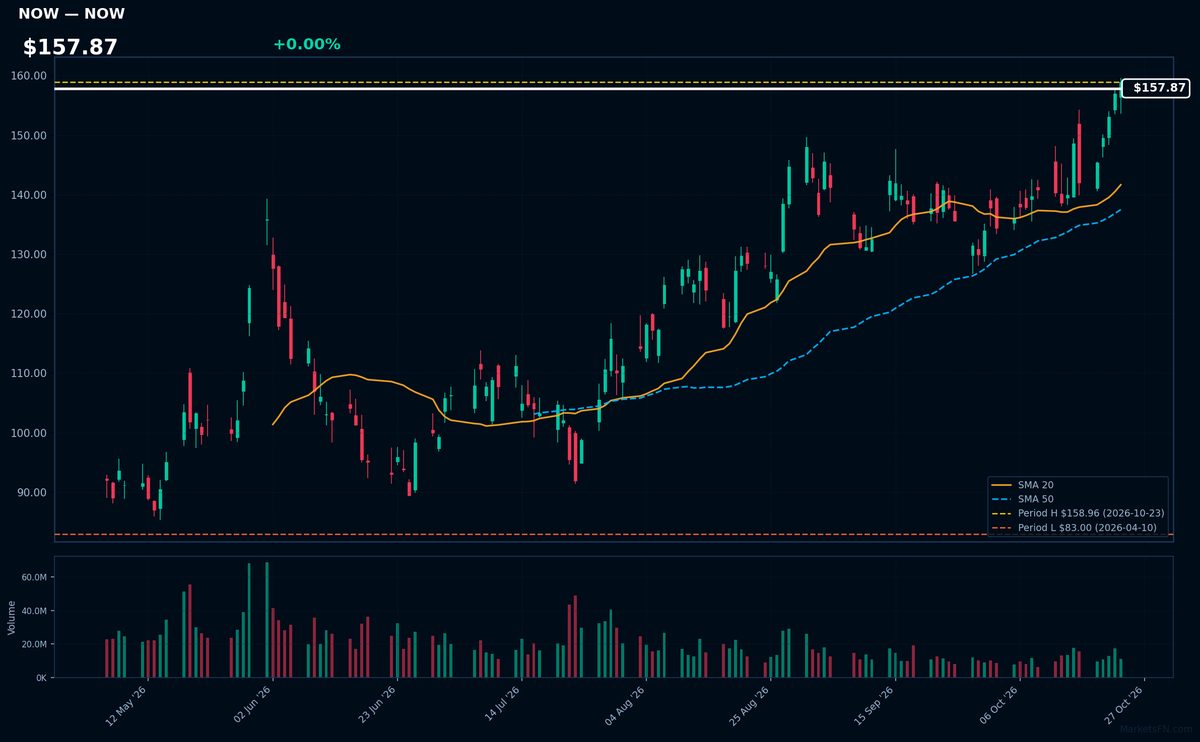
NOW | ServiceNow Inc | Technology | Price Last: $158.96 | % Realized: +7.81% | RSI: 68.2 | % above MA200: +38.0% | Trend: Above MA20, MA50, MA200
ServiceNow Inc provides cloud-based workflow automation software for IT, HR, customer service, and security operations. Investors care because enterprises rely on its platform to digitize manual processes, driving recurring revenue growth and high margins in the $100B+ digital transformation market.
Technically bullish: RSI(14) at 68.2 shows strong momentum, with price ($157.87) above all key MAs (MA20 > MA50 > MA200). The stock is 0.0% below its 2026 high, suggesting potential breakout after a 7.8% YTD gain. MA alignment confirms sustained uptrend.
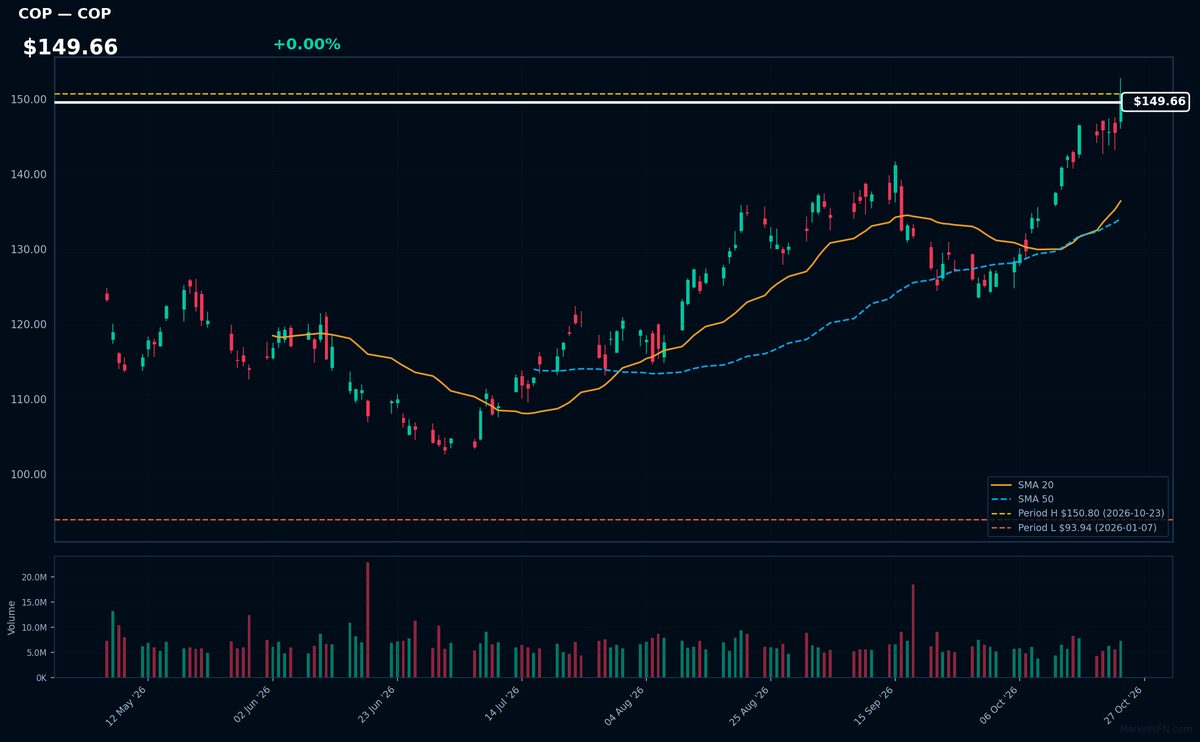
COP | Conoco Phillips | Energy | Price Last: $150.80 | % Realized: +55.95% | RSI: 73.3 | % above MA200: +25.4% | Trend: Above MA20, MA50, MA200
ConocoPhillips (COP) is a global independent E&P company focused on low-cost-of-supply oil and gas assets, including US shale and LNG. Investors care for its disciplined capital returns (25-30% cash to shareholders) and operational leverage to oil prices.
Technically overbought (RSI 73.3) but bullish MA alignment (price > MA20 > MA50 > MA200) suggests sustained momentum. At YTD highs (+55.9% YTD), watch for exhaustion.
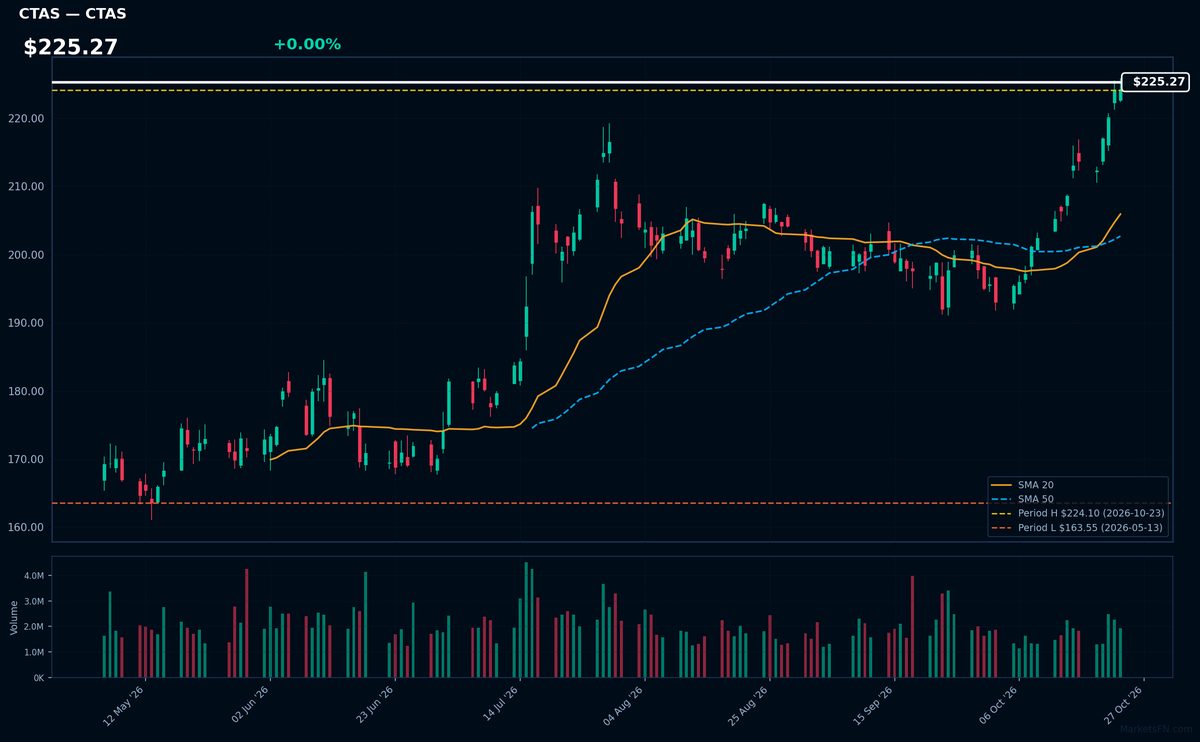
CTAS | Cintas Corporation | Industrials | Price Last: $224.10 | % Realized: +21.21% | RSI: 79.3 | % above MA200: +18.1% | Trend: Above MA20, MA50, MA200
Cintas provides corporate identity uniforms, facility services, and safety supplies to businesses. Investors care because its recurring revenue model and essential services create stable cash flows across economic cycles.
CTAS shows strong momentum with bullish MA alignment (price > MA20 > MA50 > MA200) and overbought RSI(14) at 79.3. The stock is flatlining at its YTD high after a 21.2% YTD gain, suggesting potential consolidation near breakout levels.
📉 Nearest to 2026 Low
Sectors represented: Consumer Cyclical (2), Communication Services (1), Industrials (1), Real Estate (1)
| Ticker | Company | Sector | Price Last | % Realized | 2026 YTD Low Date | RSI | % above MA200 | Trend |
|---|---|---|---|---|---|---|---|---|
| TMUS | T-Mobile US Inc | Communication Services | $146.54 | -26.58% | 2026-10-23 | 34.8 | -22.0% | Below MA20, MA50, MA200 |
| HWM | Howmet Aerospace Inc | Industrials | $185.91 | -12.19% | 2026-10-23 | 25.6 | -25.4% | Below MA20, MA50, MA200 |
| CMG | Chipotle Mexican Grill | Consumer Cyclical | $27.52 | -26.59% | 2026-10-23 | 34.4 | -19.7% | Below MA20, MA50, MA200 |
| CBRE | CBRE Group Inc | Real Estate | $123.30 | -23.03% | 2026-10-23 | 35.4 | -13.5% | Below MA20, MA50, MA200 |
| LVS | Las Vegas Sands Corp | Consumer Cyclical | $35.68 | -45.28% | 2026-10-23 | 39.6 | -27.8% | Below MA20, MA50, MA200 |
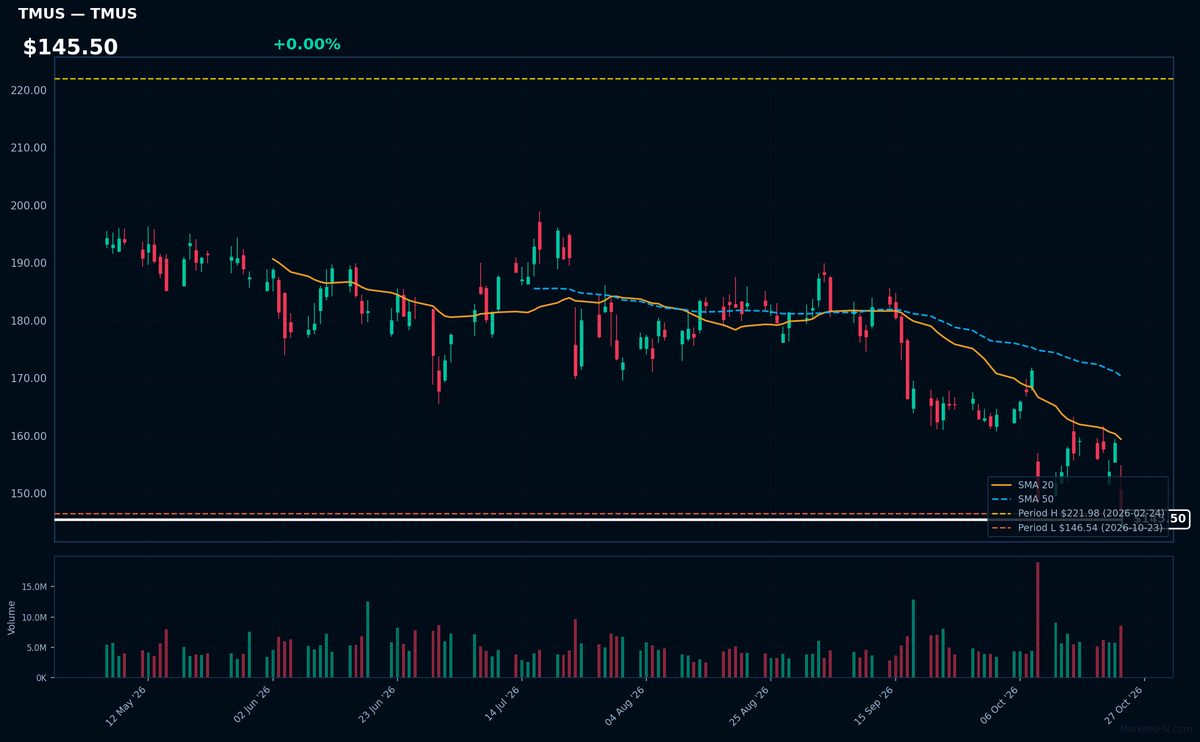
TMUS | T-Mobile US Inc | Communication Services | Price Last: $146.54 | % Realized: -26.58% | RSI: 34.8 | % above MA200: -22.0% | Trend: Below MA20, MA50, MA200
T-Mobile US Inc operates as a major wireless carrier, providing mobile communications services to consumers and businesses. Investors should care due to its disruptive pricing, 5G network expansion, and market share gains in the competitive U.S. telecom sector.
TMUS shows concerning technicals: RSI(14) at 34.8 (approaching oversold) with a sustained bearish MA alignment (price < MA20 < MA50 < MA200). The stock tests critical support, down 26.6% YTD in 2026 — a clear warning sign of persistent selling pressure.
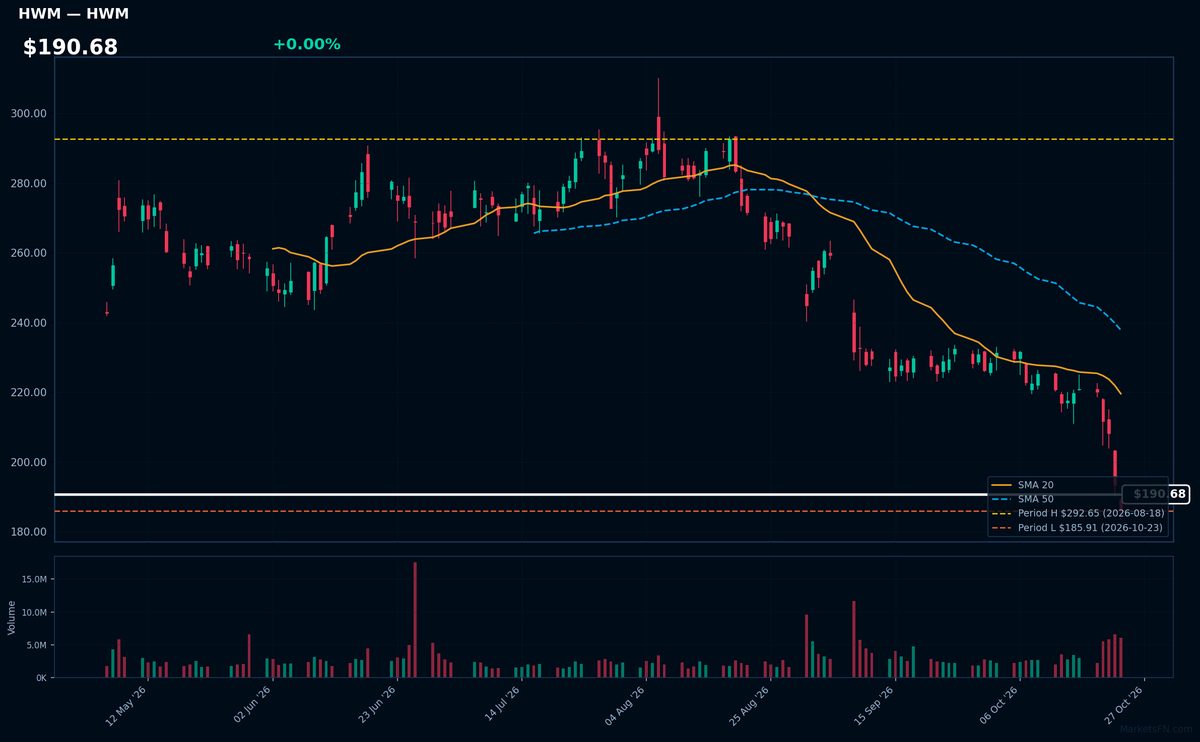
HWM | Howmet Aerospace Inc | Industrials | Price Last: $185.91 | % Realized: -12.19% | RSI: 25.6 | % above MA200: -25.4% | Trend: Below MA20, MA50, MA200
Howmet Aerospace produces engineered components for jet engines, fastening systems, and airframe structures, serving Boeing, Airbus, and defense contractors. Investors care due to its critical role in aerospace supply chains and exposure to commercial aerospace recovery cycles, with 75% of revenue tied to commercial OEMs and aftermarket parts.
HWM shows severe technical weakness: RSI(14) at 25.6 signals oversold conditions, while its bearish MA alignment (price < MA20 < MA50 < MA200) confirms a sustained downtrend. The stock tests critical support at its 2026 YTD low after a -12.2% decline, signaling capitulation risk.
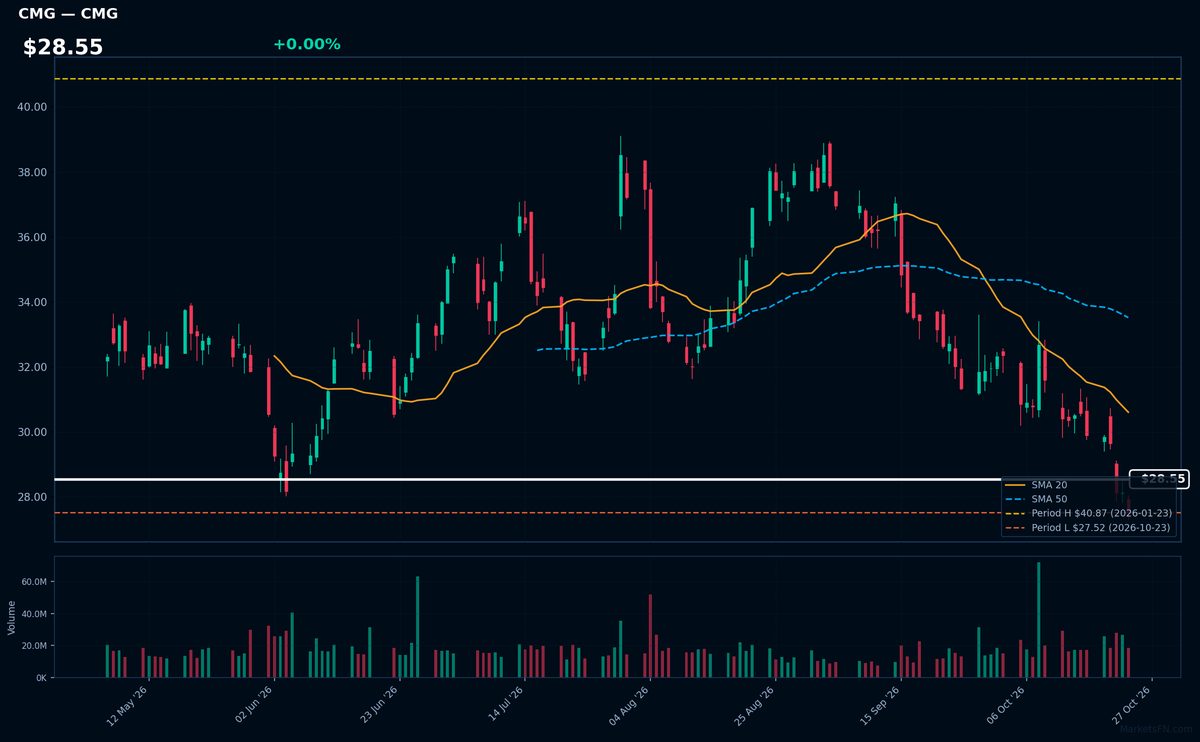
CMG | Chipotle Mexican Grill | Consumer Cyclical | Price Last: $27.52 | % Realized: -26.59% | RSI: 34.4 | % above MA200: -19.7% | Trend: Below MA20, MA50, MA200
Chipotle Mexican Grill operates fast-casual Mexican restaurants emphasizing fresh ingredients and customizable meals. Investors care due to its strong brand loyalty, unit economics, and growth potential in digital sales and international markets.
Chipotle shows bearish momentum with RSI(14) at 34.4 and sustained downtrend (price < MA20 < MA50 < MA200). Testing 2026 YTD low after -26.6% decline warns of weakening technicals.
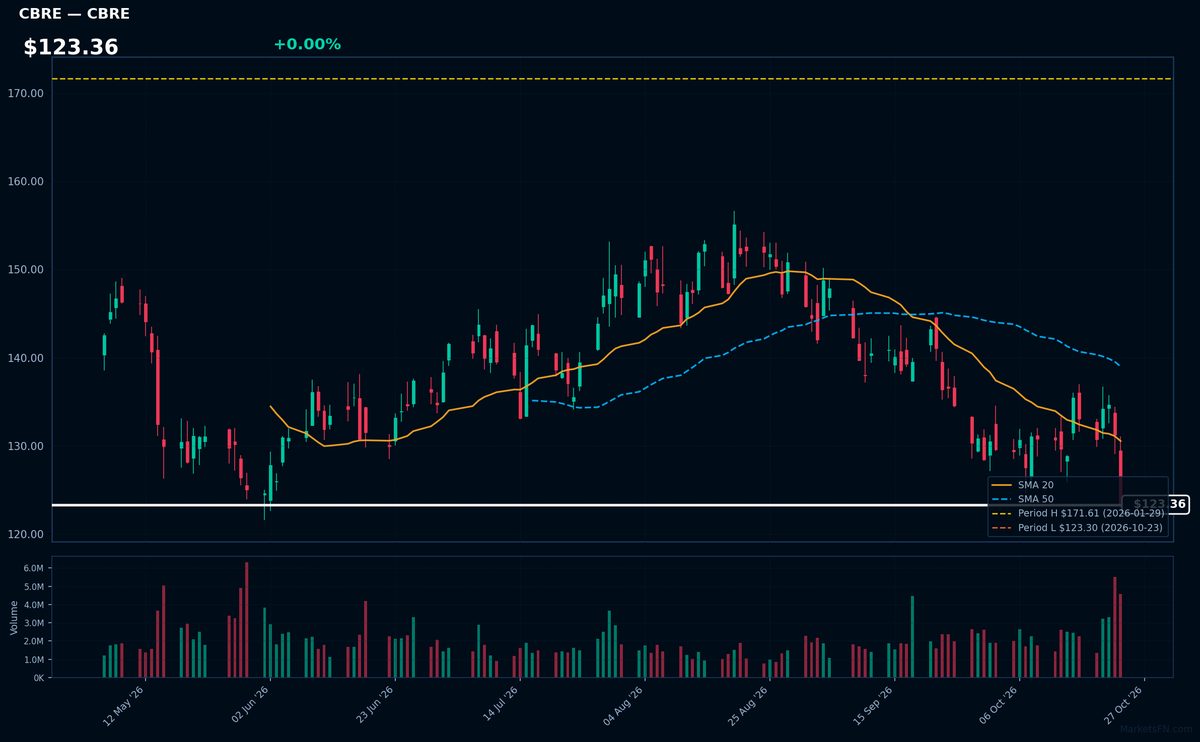
CBRE | CBRE Group Inc | Real Estate | Price Last: $123.30 | % Realized: -23.03% | RSI: 35.4 | % above MA200: -13.5% | Trend: Below MA20, MA50, MA200
CBRE Group Inc provides commercial real estate services including property sales, leasing, and investment management. Investors care because its cyclical performance reflects global CRE health, with outsized exposure to office markets undergoing structural shifts post-pandemic.
CBRE shows severe technical weakness: RSI(14) at 35.4 (approaching oversold) with bearish MA alignment (price < MA20 < MA50 < MA200). Down 23.0% YTD and testing 2026 lows, this signals sustained downtrend, not momentum. Strictly a warning sign per the data.
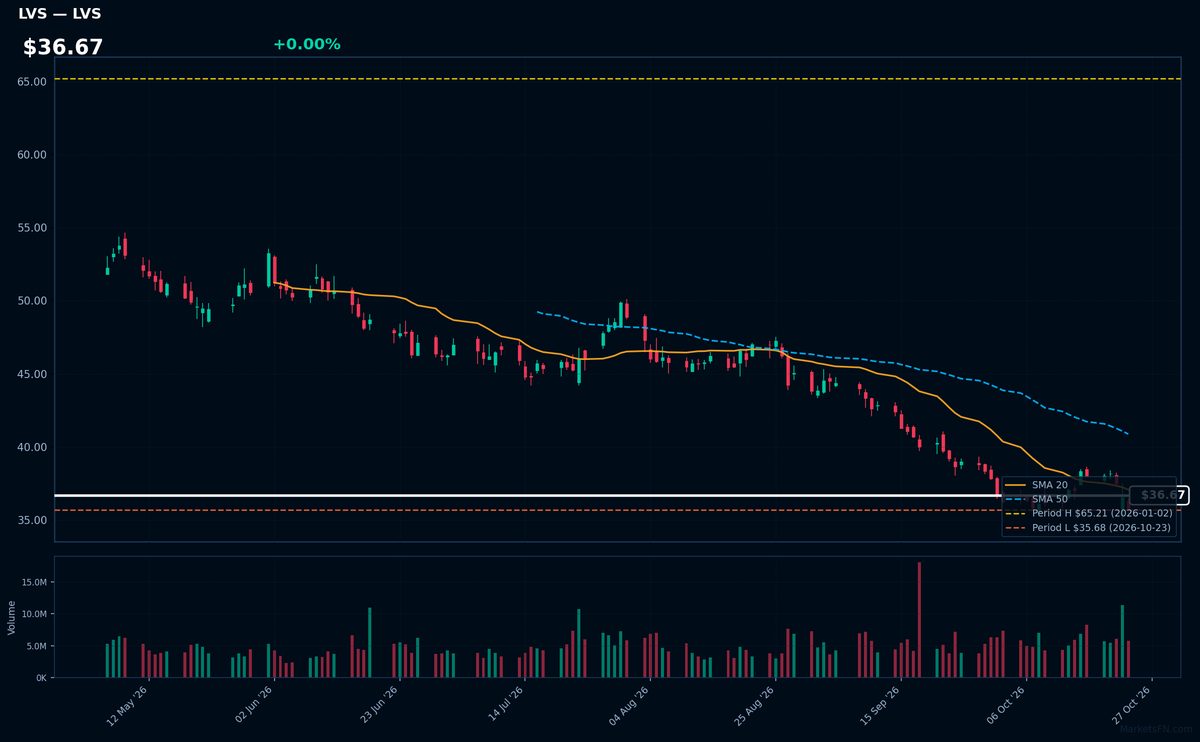
LVS | Las Vegas Sands Corp | Consumer Cyclical | Price Last: $35.68 | % Realized: -45.28% | RSI: 39.6 | % above MA200: -27.8% | Trend: Below MA20, MA50, MA200
Las Vegas Sands Corp operates integrated resorts in Macao and Singapore, generating revenue from casino gaming, hotels, and entertainment. Investors watch LVS for exposure to Asia's luxury tourism recovery and high-margin casino operations, though Macao's regulatory environment remains a key risk.
LVS shows severe technical weakness: RSI(14) at 39.6 signals near-oversold conditions, while the bearish MA alignment (price < MA20 < MA50 < MA200) confirms a sustained downtrend. The stock tests critical support, down 45.3% YTD—a clear warning sign absent fundamental catalysts.
Market Commentary
The S&P 500 stocks trading near their 2026 highs—Exxon Mobil (XOM), Chevron (CVX), ServiceNow (NOW), ConocoPhillips (COP), and Cintas (CTAS)—reflect strong momentum in energy and enterprise software sectors, alongside steady demand for business services. Conversely, T-Mobile (TMUS), Howmet Aerospace (HWM), Chipotle (CMG), CBRE Group (CBRE), and Las Vegas Sands (LVS) hovering near 2026 lows suggest pressure in telecom, aerospace, consumer discretionary, and real estate services, potentially due to cyclical headwinds or sector-specific challenges.
The divergence highlights contrasting market conditions: energy stocks (XOM, CVX, COP) may benefit from elevated commodity prices or disciplined capital allocation, while tech-enabled workflows drive NOW's outperformance. Meanwhile, TMUS and HWM could face regulatory or supply chain constraints, while CMG and LVS may reflect consumer spending shifts. CBRE's weakness could signal commercial real estate softness. These trends underscore sector rotation and selective risk appetite.
Investors should monitor energy supply dynamics, enterprise software adoption rates, and consumer resilience. For laggards, watch for inflection points in telecom competition, aerospace demand, and discretionary spending recovery. Sector-specific catalysts—such as oil price movements, cloud spending trends, or travel demand—could determine whether these extremes mark sustained trends or reversal opportunities.
Methodology: All 503 S&P 500 constituents screened. Close prices downloaded from 2026-01-01. Period high = highest close since Jan 1 2026; period low = lowest close since Jan 1 2026. Distance = (current price / period extreme − 1) × 100. Technical indicators computed on up to 1 year of daily OHLCV data.
Disclaimer: For informational purposes only. Not investment advice. Past performance is not indicative of future results.