S&P 500 2026 YTD Highs & Lows Radar: Chevron (CVX), McDonald's (MCD) and more
MarketsFN Team

Screening all 503 S&P 500 constituents for stocks nearest to their 2026 year-to-date high and their 2026 YTD low. Data as of September 14, 2026. % Realized = total return since Jan 1 2026.
Legend: RSI > 70 = overbought · RSI < 30 = oversold · Green % Realized = positive YTD return · Red = negative.
📈 Nearest to 2026 High
Sectors represented: Energy (3), Technology (1), Communication Services (1)
| Ticker | Company | Sector | Price Last | % Realized | 2026 YTD High Date | RSI | % above MA200 | Trend |
|---|---|---|---|---|---|---|---|---|
| CVX | Chevron Corp | Energy | $214.06 | +37.31% | 2026-09-11 | 71.5 | +17.2% | Above MA20, MA50, MA200 |
| COP | Conoco Phillips | Energy | $137.35 | +42.04% | 2026-09-11 | — | — | — |
| DELL | Dell Technologies Inc | Technology | $567.29 | +343.89% | 2026-09-11 | 58.8 | +115.1% | Above MA20, MA50, MA200 |
| VLO | Valero Energy Corp | Energy | $390.42 | +136.17% | 2026-09-11 | 79.9 | +59.4% | Above MA20, MA50, MA200 |
| EA | Electronic Arts, Inc | Communication Services | $209.70 | +0.38% | 2026-08-04 | — | — | — |
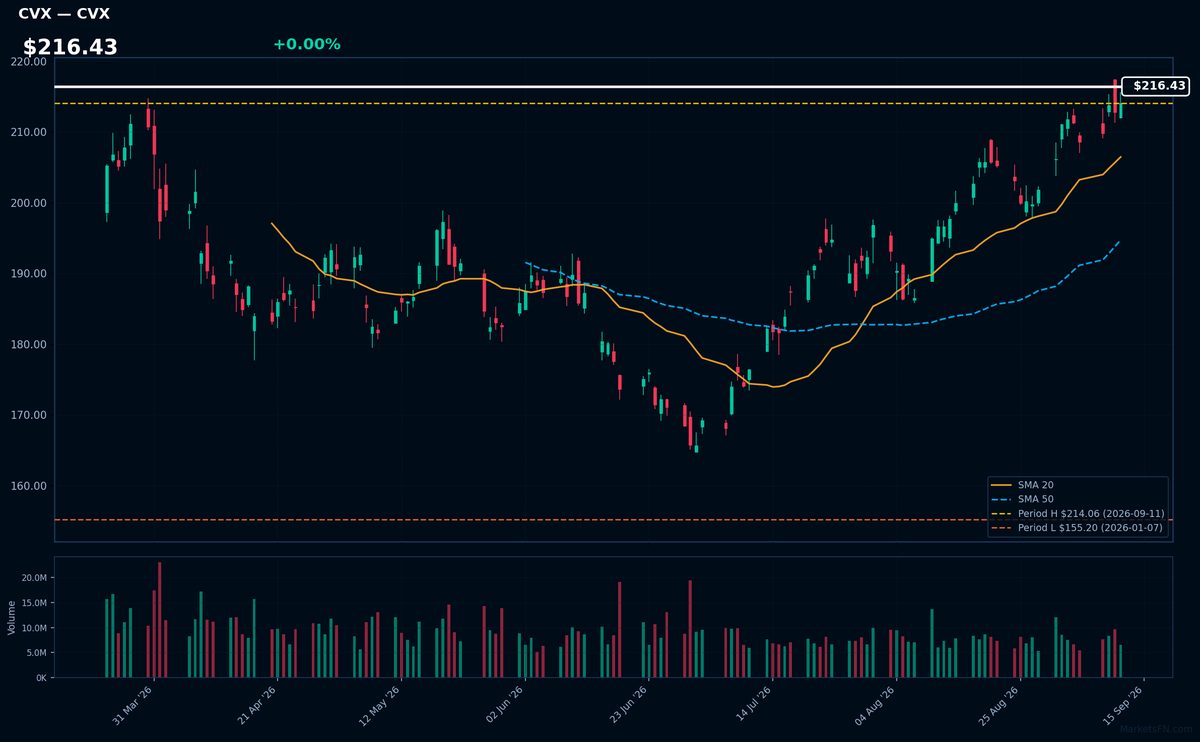
CVX | Chevron Corp | Energy | Price Last: $214.06 | % Realized: +37.31% | RSI: 71.5 | % above MA200: +17.2% | Trend: Above MA20, MA50, MA200
Chevron Corp is a multinational energy corporation that engages in the exploration, production, and refining of oil and natural gas. Investors care about its ability to navigate the energy transition while maintaining profitability through its diversified portfolio of fossil fuel assets.
Chevron Corp's current technical situation indicates strong momentum with an RSI(14) of 71.5 and a bullish MA alignment (price > MA20 > MA50 > MA200), suggesting a sustained uptrend. The stock is near its 2026 YTD high, 0.0% below, potentially setting up for a breakout.
Related headlines
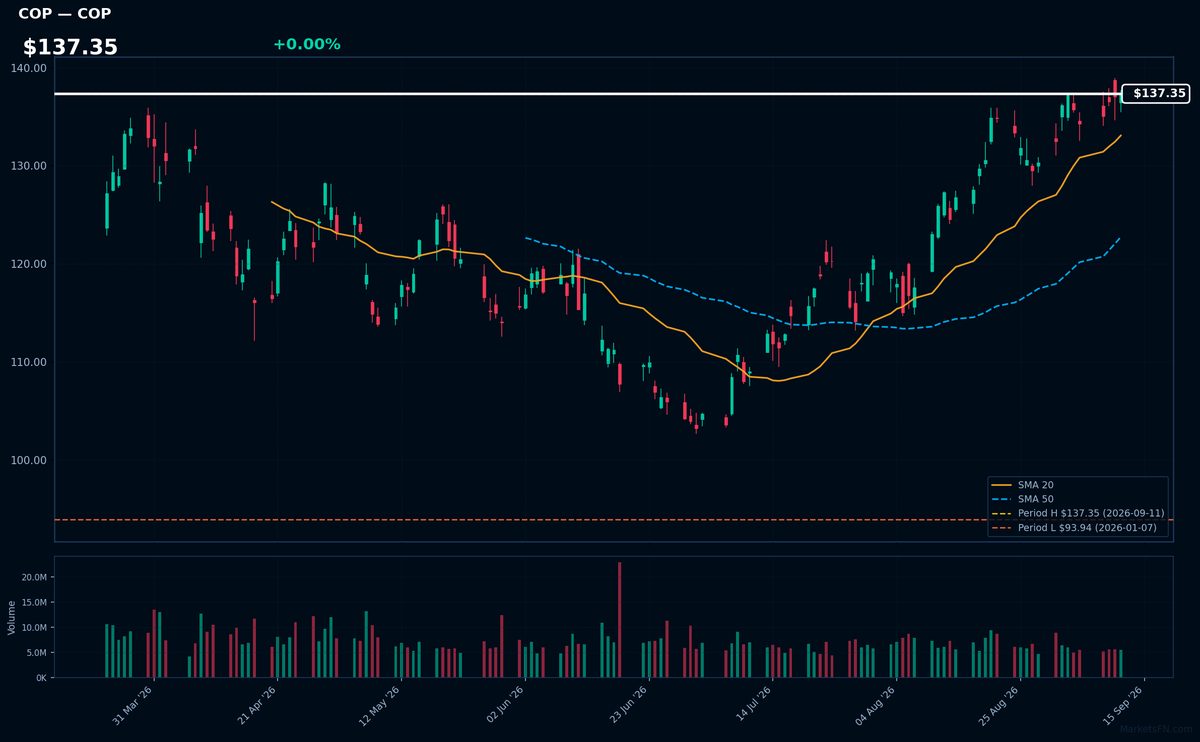
COP | Conoco Phillips | Energy | Price Last: $137.35 | % Realized: +42.04% | RSI: — | % above MA200: — | Trend: —
ConocoPhillips is an energy company involved in exploration, production, and transportation of oil and gas. Investors should care because its performance is tied to global energy demand and commodity prices, directly impacting revenue and profitability.
ConocoPhillips is 0.0% below its 2026 YTD high, indicating a potential breakout. The 42.0% 2026 YTD return suggests strong momentum. However, RSI and MA data are incomplete, so a full technical assessment is not possible.
Related headlines
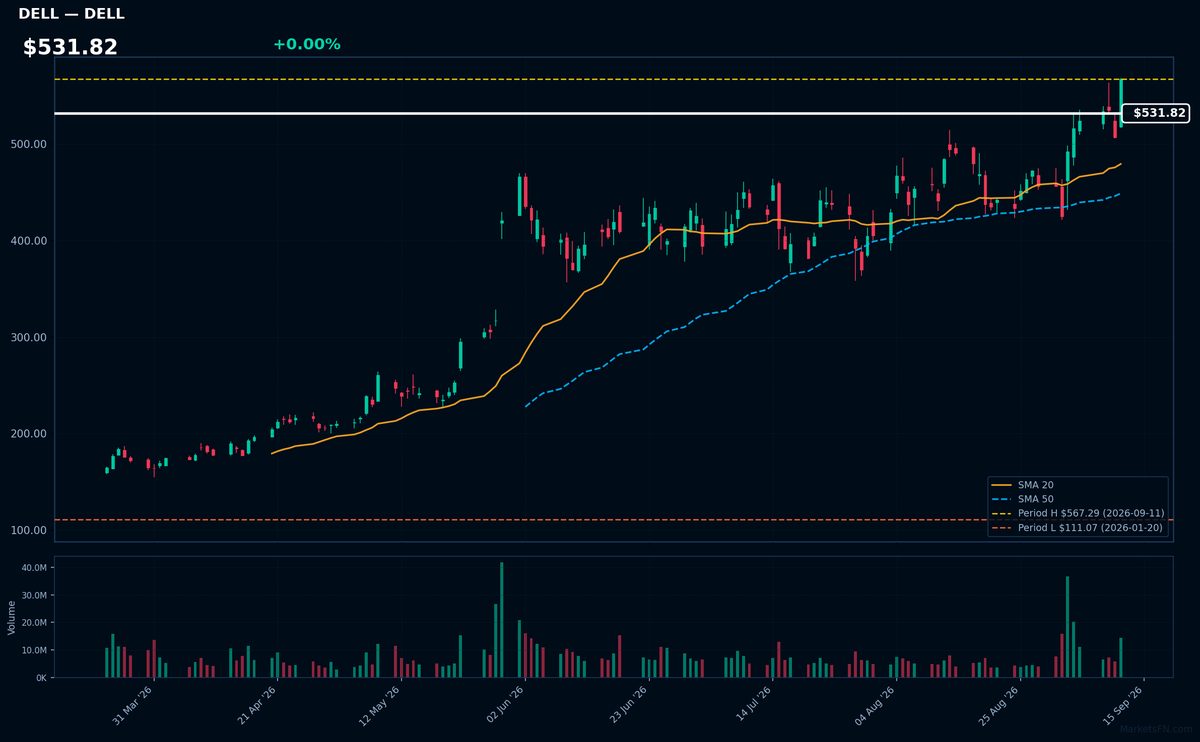
DELL | Dell Technologies Inc | Technology | Price Last: $567.29 | % Realized: +343.89% | RSI: 58.8 | % above MA200: +115.1% | Trend: Above MA20, MA50, MA200
Dell Technologies Inc is a technology company that provides a range of products and services including personal computers, data storage solutions, and IT infrastructure. Investors should care about its ability to innovate and adapt in a rapidly changing tech landscape.
Dell's current technical situation indicates sustained uptrend with price at $531.82, RSI(14) at 58.8, and bullish MA alignment: price > MA20 > MA50 > MA200. It's near a potential breakout level, 0.0% below its 2026 YTD high, with 343.9% return over 2026 YTD.
Related headlines
- Dell Shares Reach Record High After RBC Starts Coverage With Outperform Rating
- Why Did HPQ, DELL, VLO Stocks Surge To 52-Week Highs Last Week?
- Nvidia Gets the AI Hype. Dell Gets the Billionaire Fortune
- S&P 500, Dow Break Past Four-Day Loss To End Higher As Investors Eye Fed Meeting Next Week DELL, HPE, EL, WMT In Focus
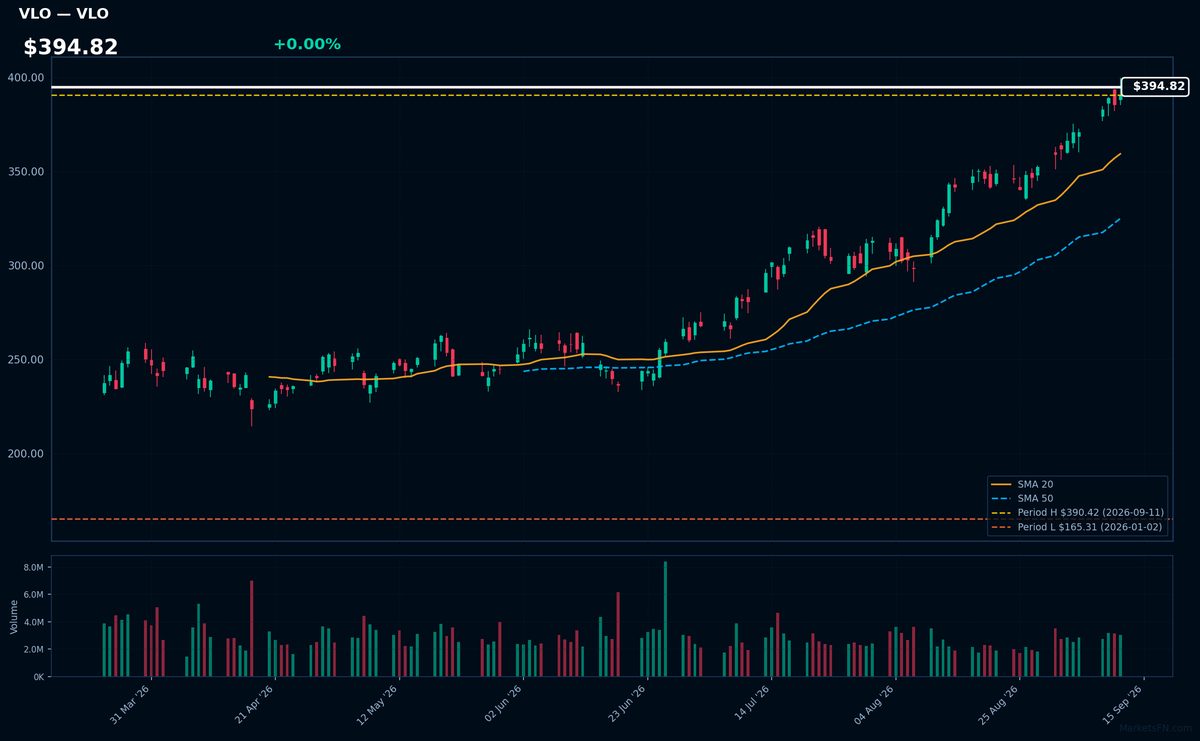
VLO | Valero Energy Corp | Energy | Price Last: $390.42 | % Realized: +136.17% | RSI: 79.9 | % above MA200: +59.4% | Trend: Above MA20, MA50, MA200
Valero Energy Corp is a major refining company that converts crude oil into fuels like gasoline and diesel, making it a key player in the energy supply chain; investors care about its profitability amid fluctuating oil prices and demand.
Valero Energy Corp's RSI(14) is 79.9, indicating overbought conditions, with a bullish MA alignment (price > MA20 > MA50 > MA200) and 0.0% below its 2026 YTD high, suggesting potential breakout momentum rather than fundamental strength or a warning sign.
Related headlines
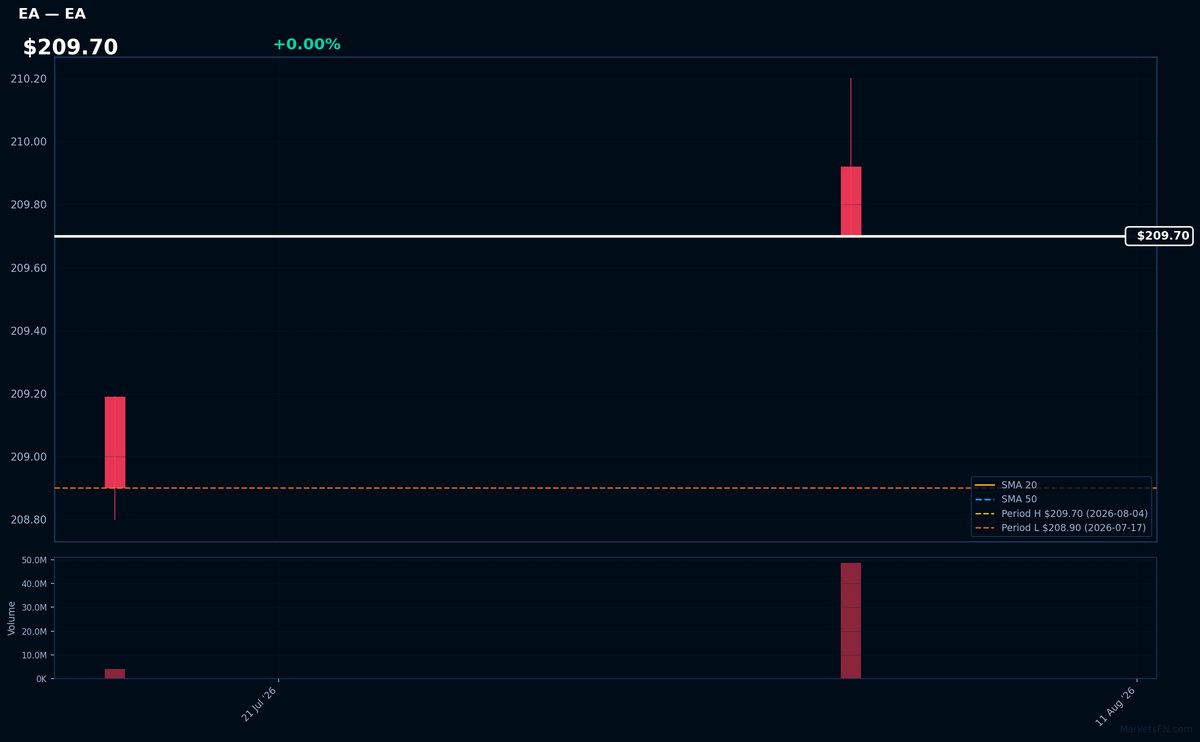
EA | Electronic Arts, Inc | Communication Services | Price Last: $209.70 | % Realized: +0.38% | RSI: — | % above MA200: — | Trend: —
Electronic Arts, Inc (EA) is a leading interactive entertainment software company. Investors should care because EA develops and publishes popular video games like FIFA, Madden NFL, and The Sims, generating significant revenue from gaming franchises.
The stock is near a potential breakout level, 0.0% below its 2026 YTD high. With a 0.4% return over the 2026 YTD period, the technical situation is neutral; however, RSI and MA data are incomplete, limiting further analysis.
📉 Nearest to 2026 Low
Sectors represented: Consumer Cyclical (3), Financial (1), Industrials (1)
| Ticker | Company | Sector | Price Last | % Realized | 2026 YTD Low Date | RSI | % above MA200 | Trend |
|---|---|---|---|---|---|---|---|---|
| MCD | McDonald's Corp | Consumer Cyclical | $252.53 | -16.73% | 2026-09-11 | 40.9 | -14.3% | Below MA20, MA50, MA200 |
| TJX | TJX Companies, Inc | Consumer Cyclical | $126.02 | -18.32% | 2026-09-11 | 20.9 | -18.3% | Below MA20, MA50, MA200 |
| AON | Aon plc | Financial | $302.69 | -12.08% | 2026-09-11 | 35.7 | -10.0% | Below MA20, MA50, MA200 |
| AZO | Autozone Inc | Consumer Cyclical | $2876.75 | -12.93% | 2026-09-11 | 47.2 | -14.3% | Below MA20, MA50, MA200 |
| LHX | L3Harris Technologies Inc | Industrials | $245.54 | -19.36% | 2026-09-11 | 26.7 | -21.6% | Below MA20, MA50, MA200 |
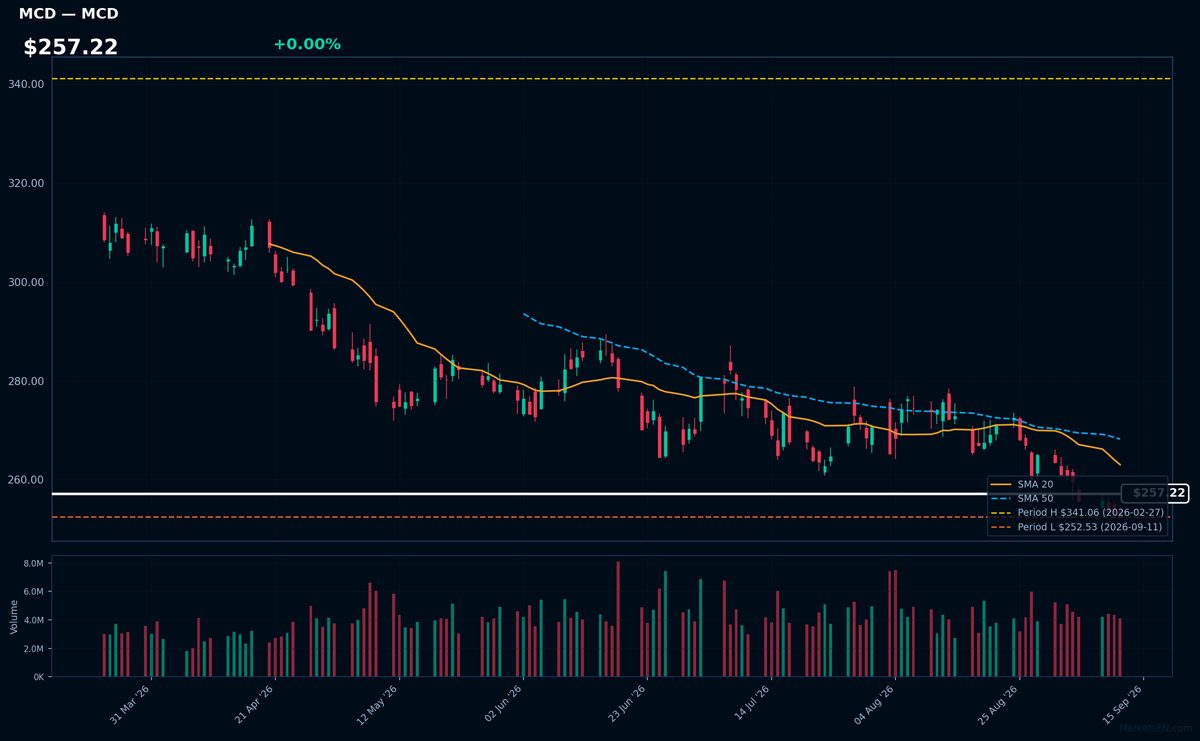
MCD | McDonald's Corp | Consumer Cyclical | Price Last: $252.53 | % Realized: -16.73% | RSI: 40.9 | % above MA200: -14.3% | Trend: Below MA20, MA50, MA200
McDonald's Corp operates a global fast-food chain, serving burgers, fries, and beverages. Investors care about its brand strength, operational efficiency, and market penetration, as these factors influence revenue growth and profitability.
McDonald's Corp is in a sustained downtrend with price ($257.22) below MA20, MA50, and MA200. The RSI(14) is 40.9, nearing oversold territory. The stock is testing major support at its 2026 YTD low, having fallen 16.7% YTD, indicating a warning sign.
Related headlines
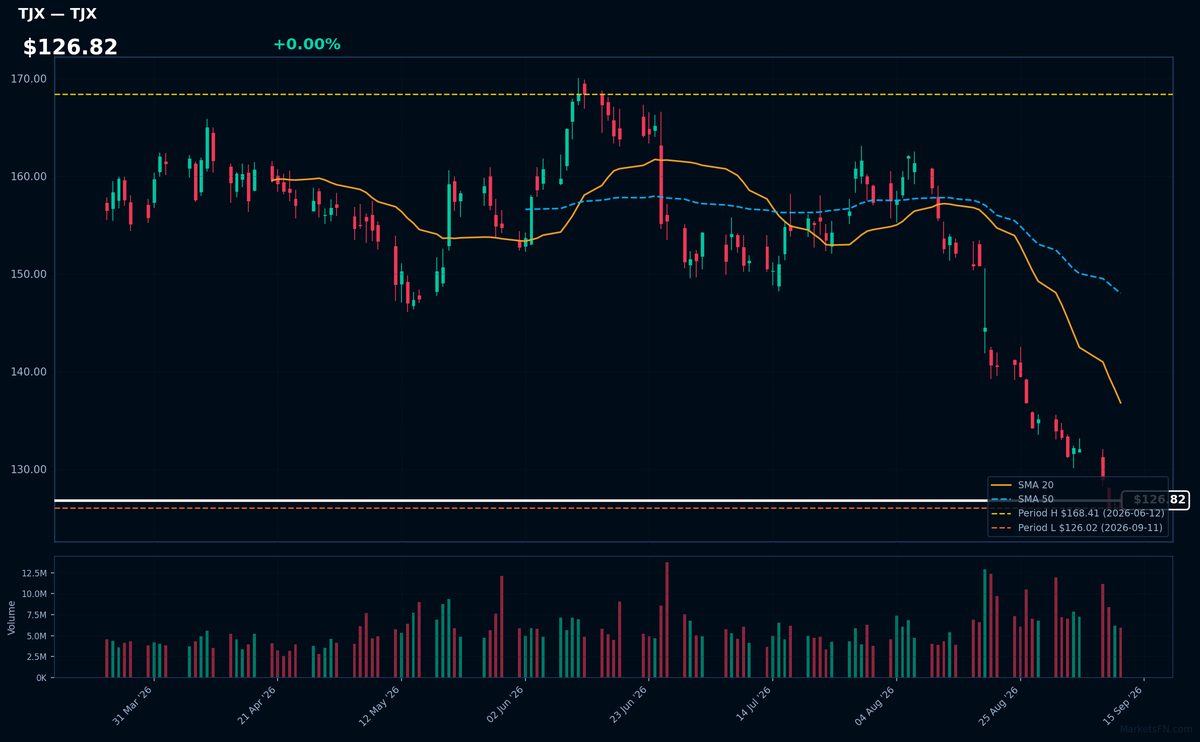
TJX | TJX Companies, Inc | Consumer Cyclical | Price Last: $126.02 | % Realized: -18.32% | RSI: 20.9 | % above MA200: -18.3% | Trend: Below MA20, MA50, MA200
TJX Companies, Inc operates as an off-price retailer of apparel and home fashions. Investors should care because its performance reflects consumer spending habits and its ability to source and price merchandise effectively in a competitive market.
TJX is in a sustained downtrend with price at $126.82 below all MAs (MA20, MA50, MA200) and an RSI(14) of 20.9, indicating oversold conditions. The stock is testing major support at its 2026 YTD low, having returned -18.3% YTD.
Related headlines
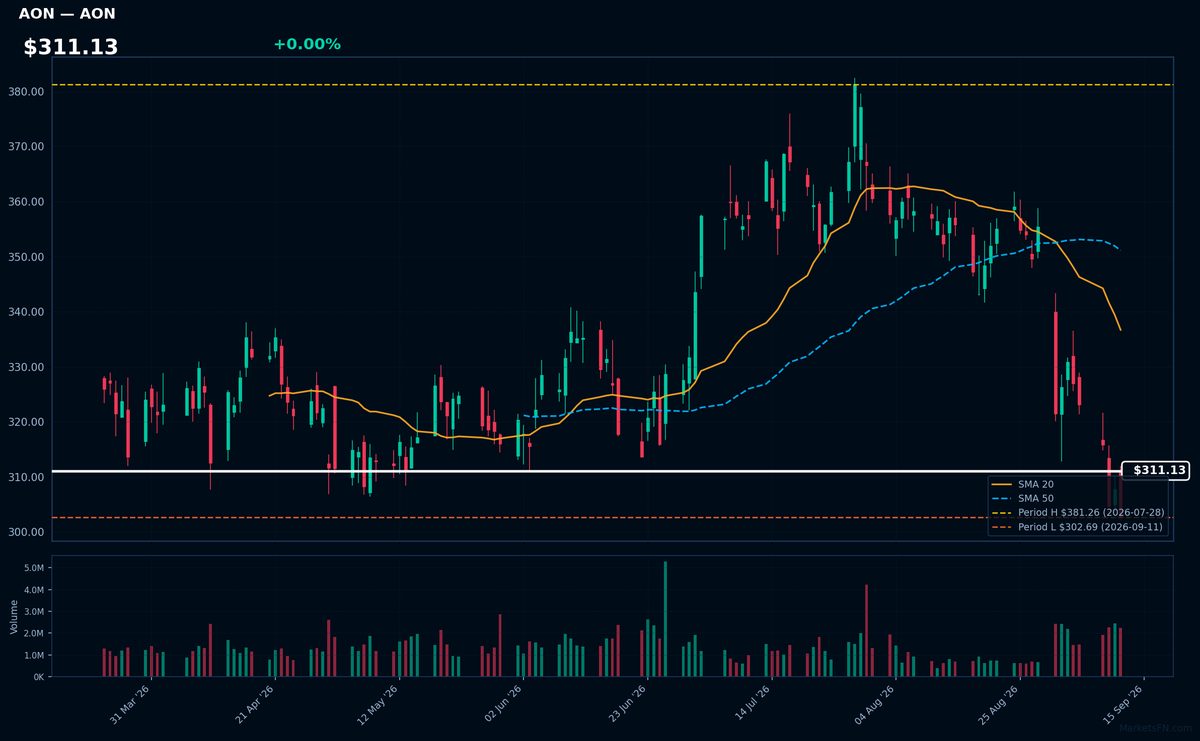
AON | Aon plc | Financial | Price Last: $302.69 | % Realized: -12.08% | RSI: 35.7 | % above MA200: -10.0% | Trend: Below MA20, MA50, MA200
Aon plc is a global risk management and insurance brokerage firm, providing critical services like reinsurance and human capital consulting; investors should care because its performance reflects the health of the insurance and risk management markets.
Aon plc's RSI(14) is 35.7, indicating oversold conditions, and its price is below MA20, MA50, and MA200, showing mixed signals; it's 0.0% above its 2026 YTD low, testing major support, suggesting a potential warning sign.
Related headlines
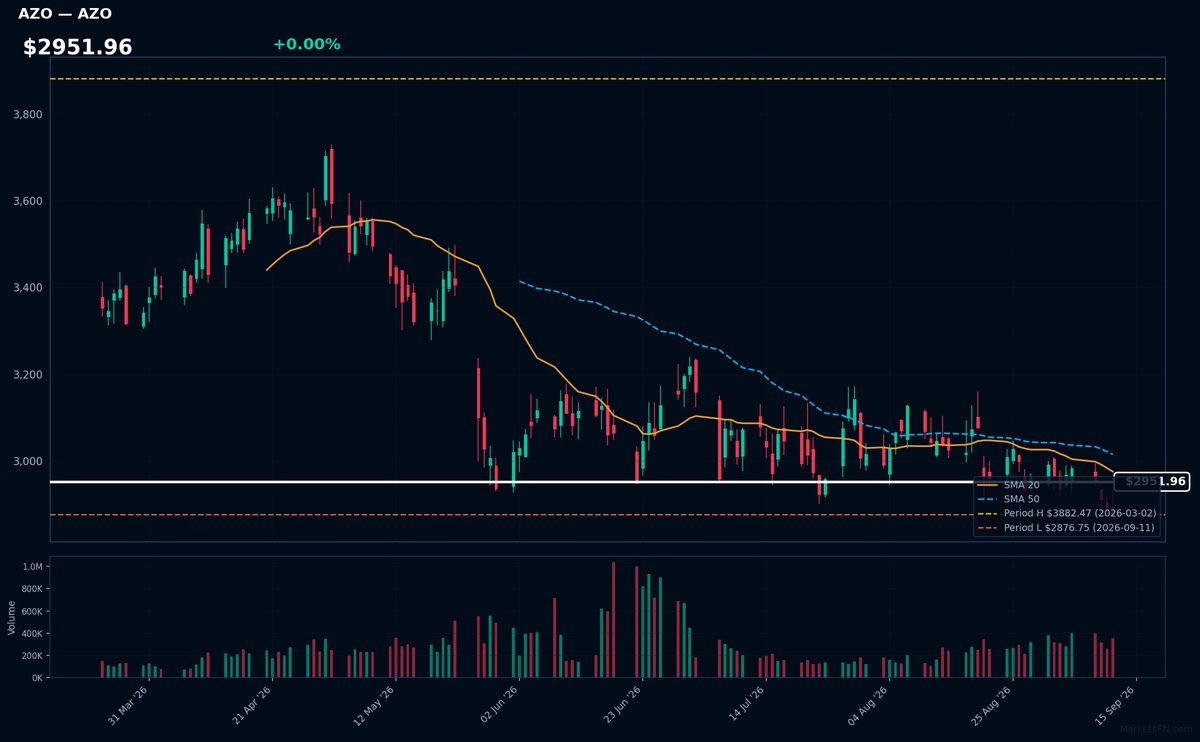
AZO | Autozone Inc | Consumer Cyclical | Price Last: $2876.75 | % Realized: -12.93% | RSI: 47.2 | % above MA200: -14.3% | Trend: Below MA20, MA50, MA200
Autozone Inc (AZO) is an auto parts retailer. Investors should care because its performance reflects consumer spending on vehicle maintenance and repair, indicating the health of the automotive aftermarket sector.
AZO's technicals indicate a sustained downtrend with price ($2951.96) below MA20, MA50, and MA200. RSI(14) is 47.2, nearing oversold territory. The stock is testing major support at its 2026 YTD low, having returned -12.9% YTD.
Related headlines
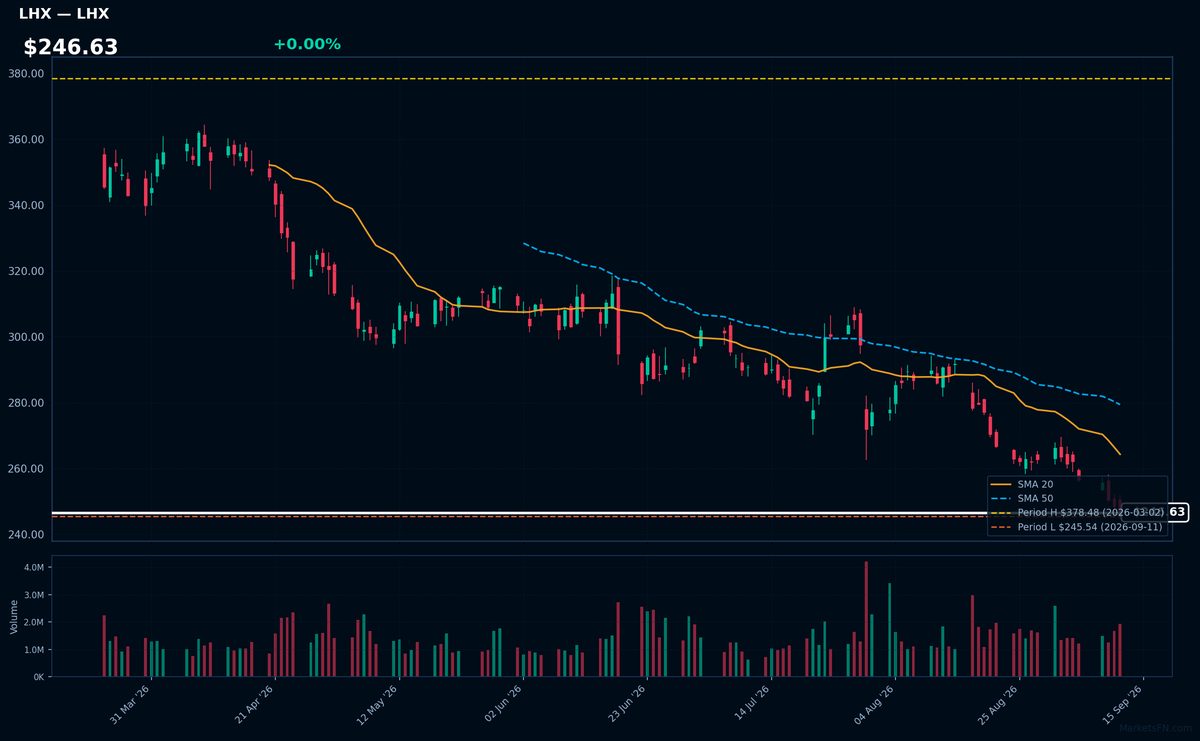
LHX | L3Harris Technologies Inc | Industrials | Price Last: $245.54 | % Realized: -19.36% | RSI: 26.7 | % above MA200: -21.6% | Trend: Below MA20, MA50, MA200
L3Harris Technologies Inc is a defense technology company providing advanced defense and commercial technologies. Investors should care due to its significant role in the defense industry, with potential impacts from government spending and geopolitical tensions.
L3Harris is in a sustained downtrend with price ($246.63) below MA20, MA50, and MA200. The RSI(14) is 26.7, near oversold territory, and the stock is at its 2026 YTD low, indicating a potential warning sign.
Related headlines
Market Commentary
The S&P 500 stocks listed are currently trading near their year-to-date (YTD) extremes for 2026. For stocks near their 2026 highs, such as CVX, COP, DELL, VLO, and EA, this indicates they have reached their highest price levels since the start of 2026 and are now at 0.0% from their YTD highs. Conversely, stocks like MCD, TJX, AON, AZO, and LHX are at their YTD lows, having risen by +0.0% above their lowest 2026 prices.
The stocks near their 2026 highs are from diverse sectors, including energy (CVX, COP, VLO), technology (DELL, EA), indicating strong performance across different industries. The energy sector's strength could be attributed to market conditions favoring energy companies. Stocks near their 2026 lows span consumer staples (MCD), retail (TJX), financial services (AON), consumer discretionary (AZO), and industrials (LHX), suggesting a potential downturn or stabilization in these sectors.
Investors should monitor these stocks for signs of continued strength or weakness, particularly watching for any deviation from their current extremes. Changes in their prices relative to their YTD highs or lows could signal shifts in sector performance and broader market trends.
Methodology: All 503 S&P 500 constituents screened. Close prices downloaded from 2026-01-01. Period high = highest close since Jan 1 2026; period low = lowest close since Jan 1 2026. Distance = (current price / period extreme − 1) × 100. Technical indicators computed on up to 1 year of daily OHLCV data.
Disclaimer: For informational purposes only. Not investment advice. Past performance is not indicative of future results.


