S&P 500 2026 YTD Highs & Lows Radar: Berkshire Hathaway (BRK-B), Prologis (PLD) and more
MarketsFN Team

Screening all 503 S&P 500 constituents for stocks nearest to their 2026 year-to-date high and their 2026 YTD low. Data as of October 20, 2026. % Realized = total return since Jan 1 2026.
Legend: RSI > 70 = overbought · RSI < 30 = oversold · Green % Realized = positive YTD return · Red = negative.
📈 Nearest to 2026 High
Sectors represented: Financial (2), Healthcare (2), Basic Materials (1)
| Ticker | Company | Sector | Price Last | % Realized | 2026 YTD High Date | RSI | % above MA200 | Trend |
|---|---|---|---|---|---|---|---|---|
| BRK-B | Berkshire Hathaway Inc | Financial | $532.23 | +7.12% | 2026-10-19 | 78.1 | +7.8% | Above MA20, MA50, MA200 |
| V | Visa Inc | Financial | $402.92 | +16.29% | 2026-10-19 | 75.6 | +18.6% | Above MA20, MA50, MA200 |
| MCK | Mckesson Corporation | Healthcare | $1010.43 | +22.71% | 2026-10-19 | 78.2 | +18.1% | Above MA20, MA50, MA200 |
| ELV | Elevance Health Inc | Healthcare | $430.23 | +21.45% | 2026-10-19 | 71.0 | +16.3% | Above MA20, MA50, MA200 |
| IFF | International Flavors & Fragrances Inc | Basic Materials | $90.96 | +33.71% | 2026-10-19 | 76.2 | +17.2% | Above MA20, MA50, MA200 |
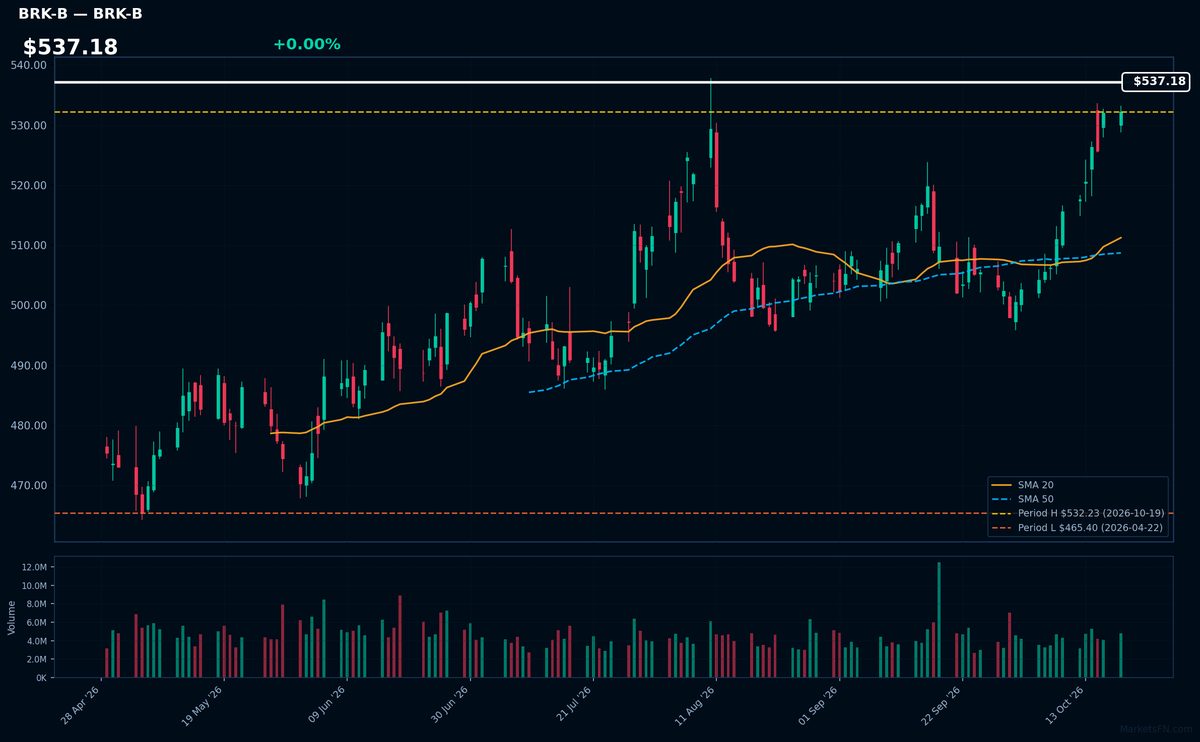
BRK-B | Berkshire Hathaway Inc | Financial | Price Last: $532.23 | % Realized: +7.12% | RSI: 78.1 | % above MA200: +7.8% | Trend: Above MA20, MA50, MA200
Berkshire Hathaway operates a massive insurance business (GEICO, reinsurance) and owns dozens of companies like BNSF Railway and Dairy Queen. Investors care because Warren Buffett's value investing approach and diversified cash flows make it a defensive play with steady growth.
Technically overbought (RSI 78.1) but in strong uptrend (price > MA20 > MA50 > MA200). At YTD highs (+7.1% in 2026), suggesting momentum but RSI warns of potential pullback.
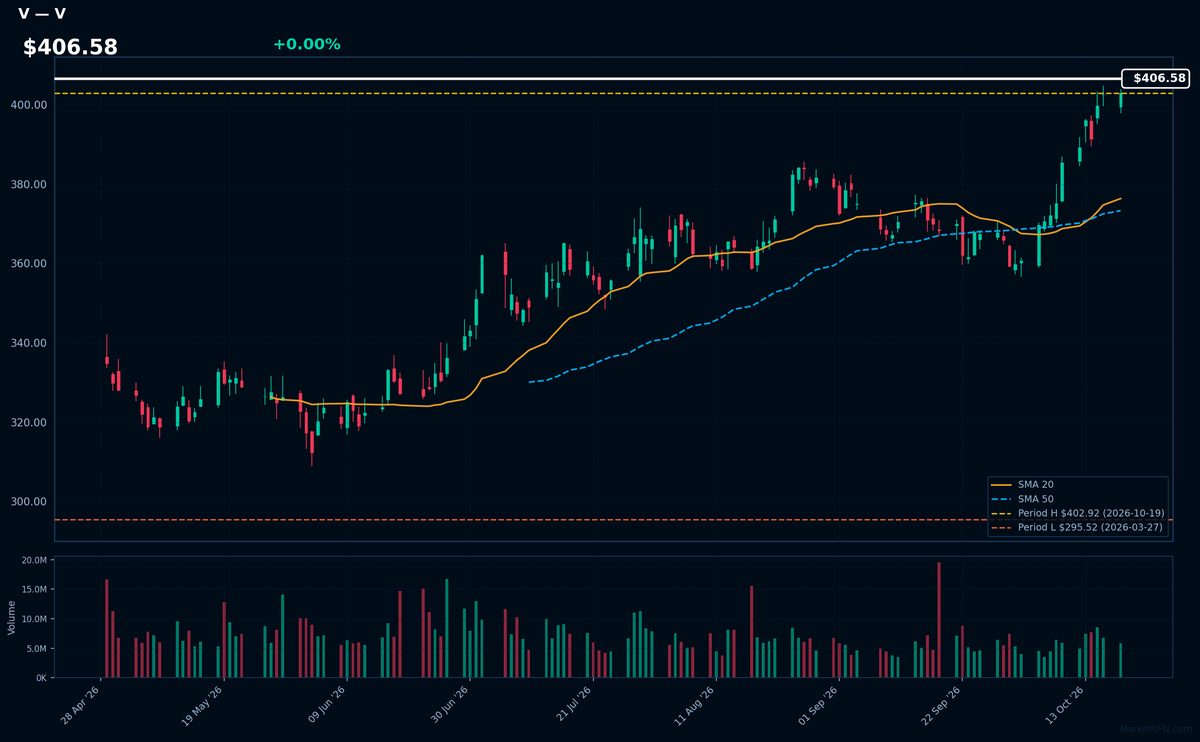
V | Visa Inc | Financial | Price Last: $402.92 | % Realized: +16.29% | RSI: 75.6 | % above MA200: +18.6% | Trend: Above MA20, MA50, MA200
Visa operates the world's largest payment network, processing $14.4 trillion annually across 200+ countries. Investors care because its asset-light model (no credit risk) generates 57% operating margins as digital payments grow 12% annually, making it a pure-play on cash displacement.
Technically overbought (RSI 75.6) but in strong uptrend (price > MA20 > MA50 > MA200). At YTD highs after 16.3% gain, suggesting momentum but vulnerable to pullback given extreme RSI.
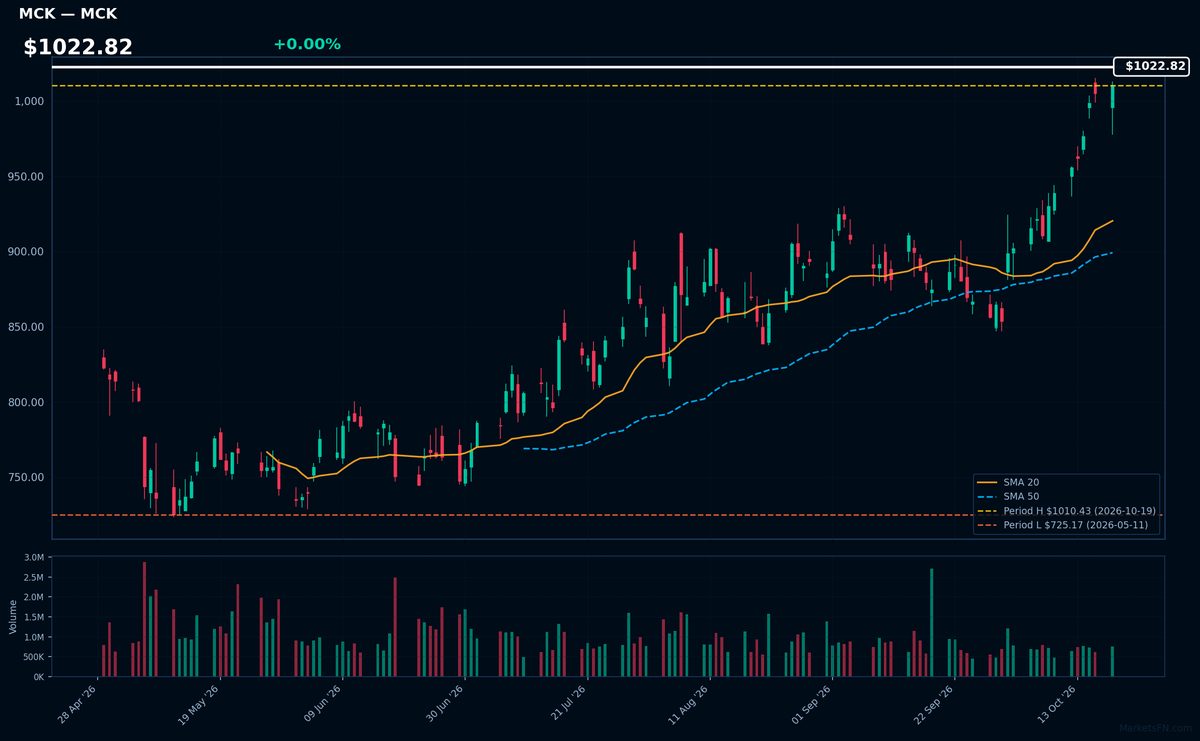
MCK | Mckesson Corporation | Healthcare | Price Last: $1010.43 | % Realized: +22.71% | RSI: 78.2 | % above MA200: +18.1% | Trend: Above MA20, MA50, MA200
Mckesson Corporation is a pharmaceutical distributor and healthcare technology provider, connecting manufacturers with pharmacies/hospitals. Investors care due to its critical role in drug supply chains and recurring revenue model from essential medical product distribution.
Technically overbought (RSI 78.2) but in strong uptrend (price > MA20 > MA50 > MA200). 22.7% YTD surge suggests momentum, though RSI warns of potential consolidation near all-time highs.
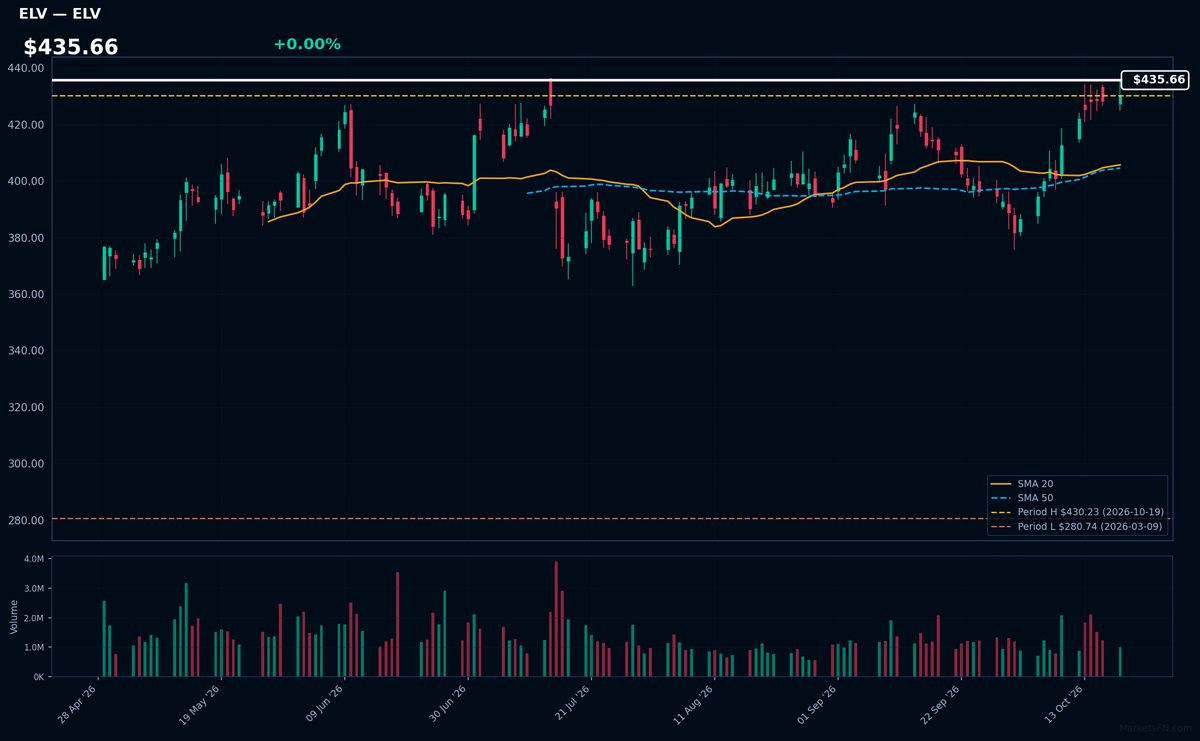
ELV | Elevance Health Inc | Healthcare | Price Last: $430.23 | % Realized: +21.45% | RSI: 71.0 | % above MA200: +16.3% | Trend: Above MA20, MA50, MA200
Elevance Health Inc operates as a health benefits company, providing medical, pharmacy, and specialty solutions. Investors should care due to its essential role in healthcare administration and potential resilience in economic downturns, given the non-discretionary nature of healthcare services.
Elevance shows bullish momentum with price at $435.66 above all key MAs (20/50/200) and RSI(14) at 71.0, nearing overbought territory. The stock is 0.0% below its 2026 YTD high after gaining 21.4% YTD, suggesting strong uptrend continuation but warranting caution at these extended levels.
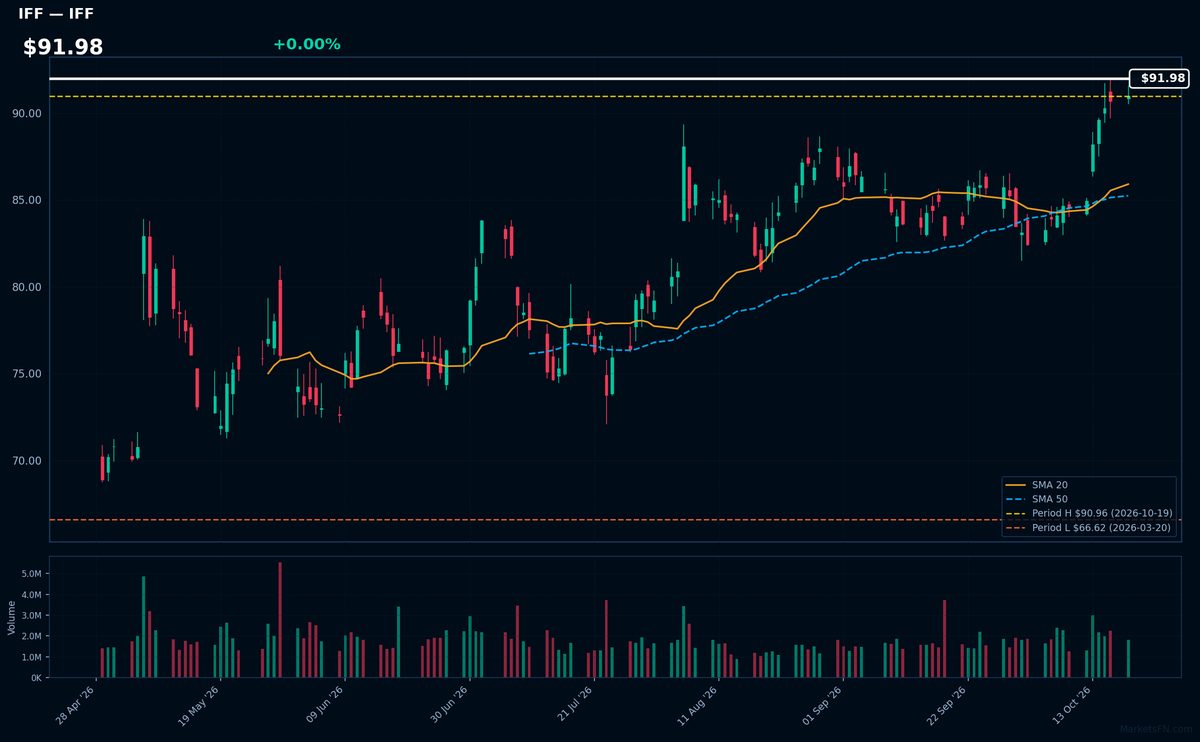
IFF | International Flavors & Fragrances Inc | Basic Materials | Price Last: $90.96 | % Realized: +33.71% | RSI: 76.2 | % above MA200: +17.2% | Trend: Above MA20, MA50, MA200
International Flavors & Fragrances Inc (IFF) develops specialty ingredients for food, beverage, fragrance, and personal care products. Investors should care because its formulations are critical to global consumer goods, creating steady demand despite economic cycles.
Technically bullish with RSI(14) at 76.2 (overbought) and price > MA20 > MA50 > MA200. The 33.7% YTD surge suggests momentum, but extreme RSI warrants caution near the YTD high.
📉 Nearest to 2026 Low
Sectors represented: Real Estate (1), Technology (1), Communication Services (1), Consumer Cyclical (1), Basic Materials (1)
| Ticker | Company | Sector | Price Last | % Realized | 2026 YTD Low Date | RSI | % above MA200 | Trend |
|---|---|---|---|---|---|---|---|---|
| PLD | Prologis Inc | Real Estate | $124.09 | -3.84% | 2026-10-19 | 33.9 | -10.0% | Below MA20, MA50, MA200 |
| FSLR | First Solar Inc | Technology | $171.80 | -37.38% | 2026-10-19 | 37.3 | -21.5% | Below MA20, MA50, MA200 |
| PSKY | Paramount Skydance Corp | Communication Services | $6.91 | -13.08% | 2026-10-16 | 34.7 | — | — |
| MGM | MGM Resorts International | Consumer Cyclical | $28.47 | -21.98% | 2026-10-19 | 16.7 | -27.6% | Below MA20, MA50, MA200 |
| MOS | Mosaic Company | Basic Materials | $17.92 | -28.38% | 2026-10-19 | 22.6 | -26.0% | Below MA20, MA50, MA200 |
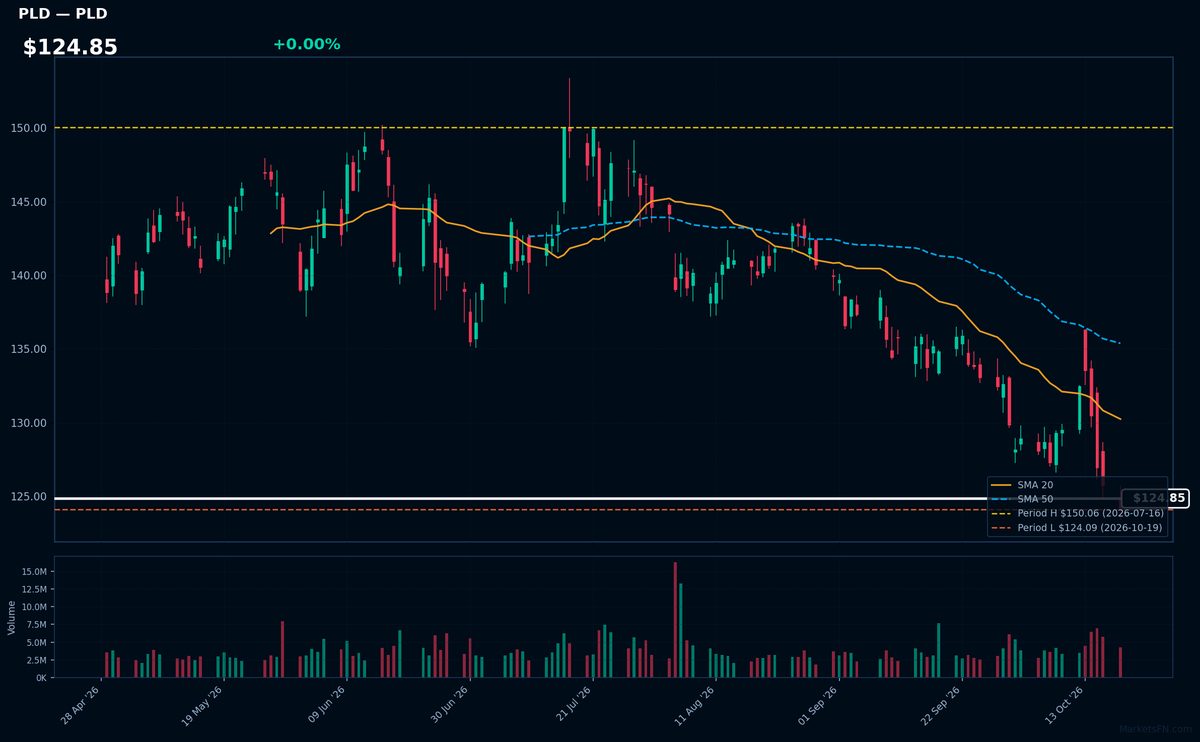
PLD | Prologis Inc | Real Estate | Price Last: $124.09 | % Realized: -3.84% | RSI: 33.9 | % above MA200: -10.0% | Trend: Below MA20, MA50, MA200
Prologis Inc (PLD) owns and operates logistics real estate globally, specializing in high-demand warehouse/distribution centers critical for e-commerce and supply chains. Investors watch PLD as a barometer of trade activity and industrial real estate health.
PLD shows severe technical weakness: RSI(14) at 33.9 (approaching oversold) with bearish MA alignment (price < MA20 < MA50 < MA200). The stock tests 2026 lows (-3.8% YTD), signaling sustained downtrend pressure.
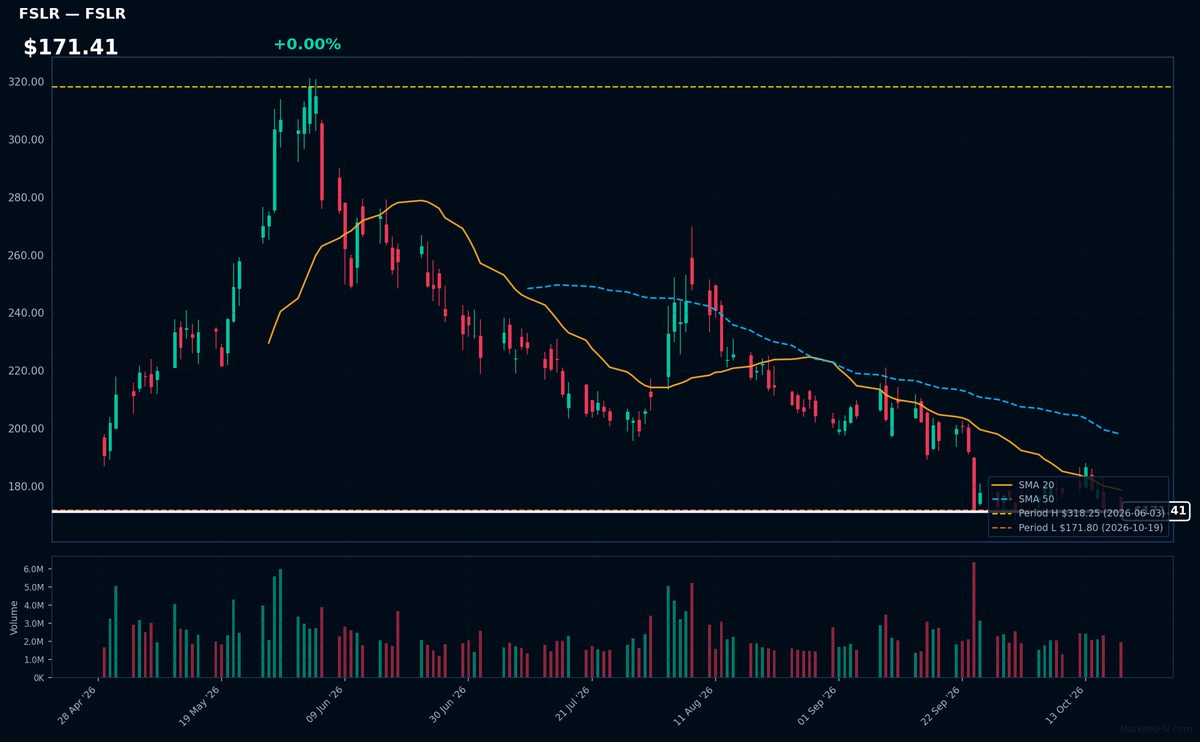
FSLR | First Solar Inc | Technology | Price Last: $171.80 | % Realized: -37.38% | RSI: 37.3 | % above MA200: -21.5% | Trend: Below MA20, MA50, MA200
First Solar manufactures thin-film solar panels using proprietary cadmium telluride technology, offering lower production costs than silicon-based rivals. Investors watch FSLR as a pure-play on utility-scale solar projects, where its panels dominate due to superior performance in high-temperature environments.
FSLR shows severe technical weakness: RSI(14) at 37.3 signals near-oversold conditions, while the bearish MA alignment (price < MA20 < MA50 < MA200) confirms a sustained downtrend. The stock tests critical support, down 37.4% YTD — a clear warning sign.
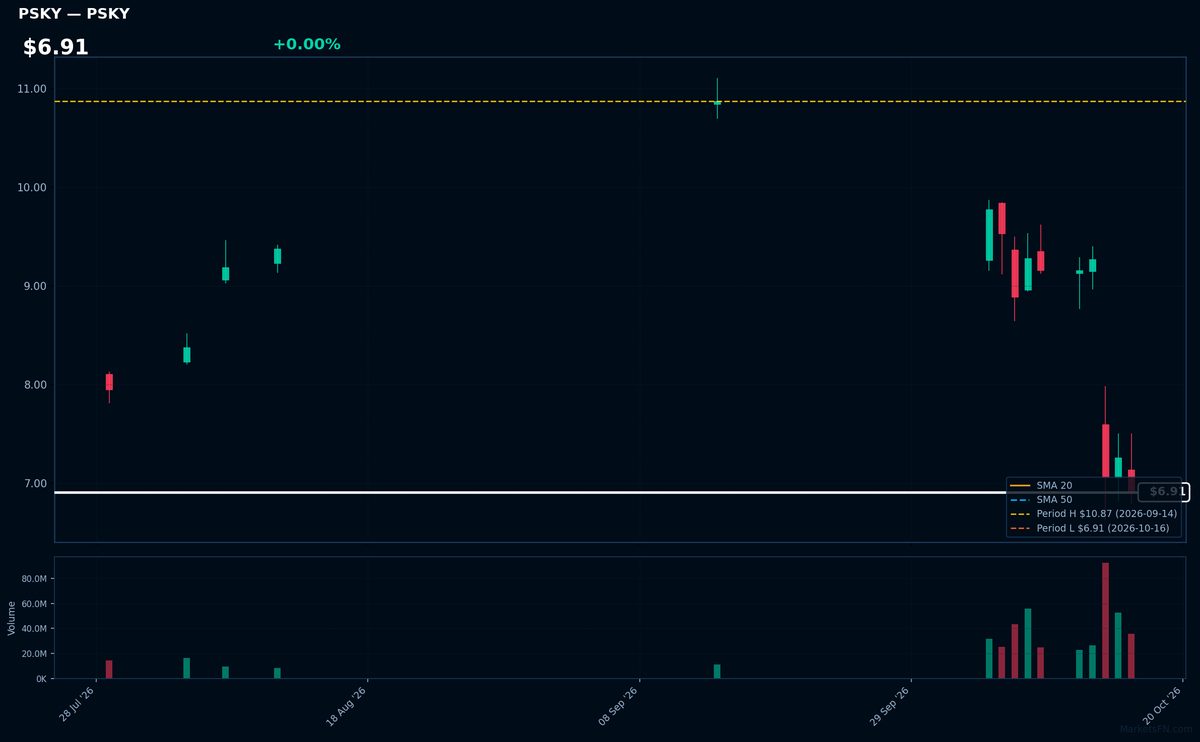
PSKY | Paramount Skydance Corp | Communication Services | Price Last: $6.91 | % Realized: -13.08% | RSI: 34.7 | % above MA200: — | Trend: —
Paramount Skydance Corp (PSKY) operates in [specific industry not provided in data]. Investors should monitor its [specific catalysts not provided in data] given its extreme proximity to YTD lows, suggesting heightened sensitivity to near-term developments.
PSKY trades at $6.91 with oversold RSI(14) at 34.7 and no MA confirmation. Down 13.1% YTD, this tests critical support—a warning sign, not momentum. The 0.0% buffer above 2026 lows shows vulnerability.
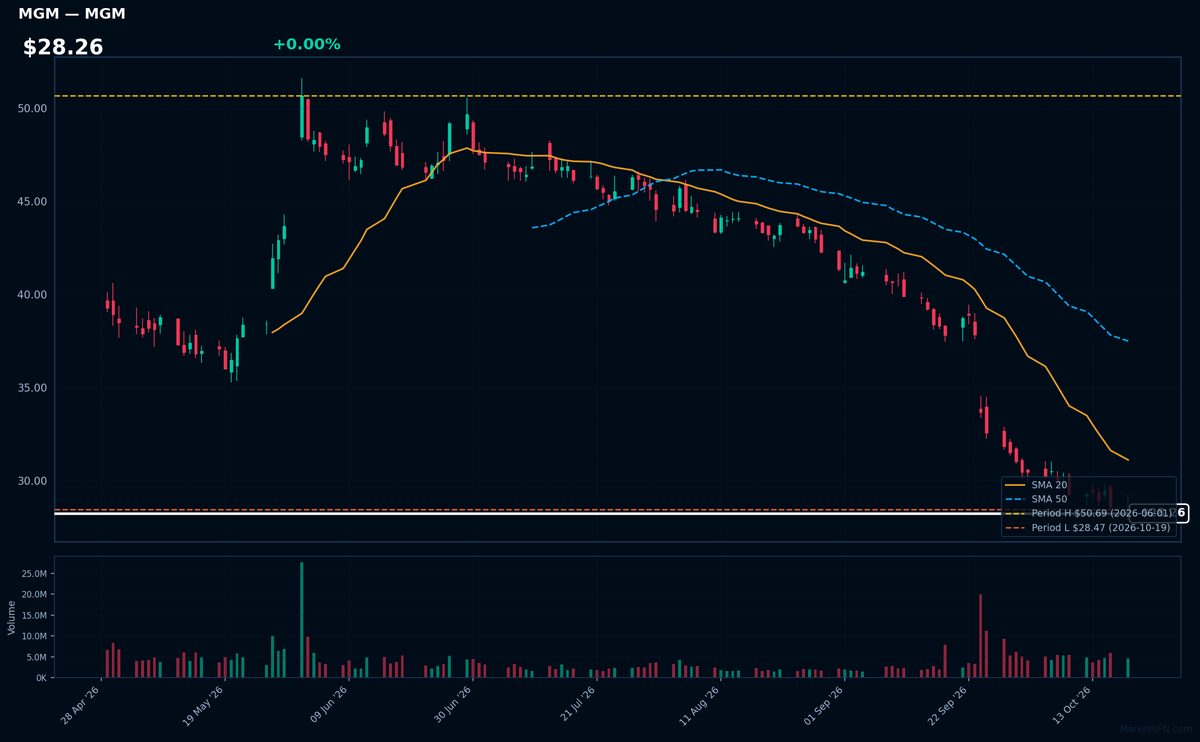
MGM | MGM Resorts International | Consumer Cyclical | Price Last: $28.47 | % Realized: -21.98% | RSI: 16.7 | % above MA200: -27.6% | Trend: Below MA20, MA50, MA200
MGM Resorts International operates luxury casinos, hotels, and entertainment venues in Las Vegas and globally. Investors watch MGM for its high-beta exposure to consumer discretionary spending, regional gaming demand, and convention traffic—key cyclical drivers in gaming and hospitality.
MGM trades at $28.26 with extreme weakness: RSI(14) at 16.7 (oversold) and bearish MA alignment (price < MA20 < MA50 < MA200). Down 22.0% YTD and testing 2026 lows, this reflects capitulation—not momentum. Strictly a warning sign per the data.
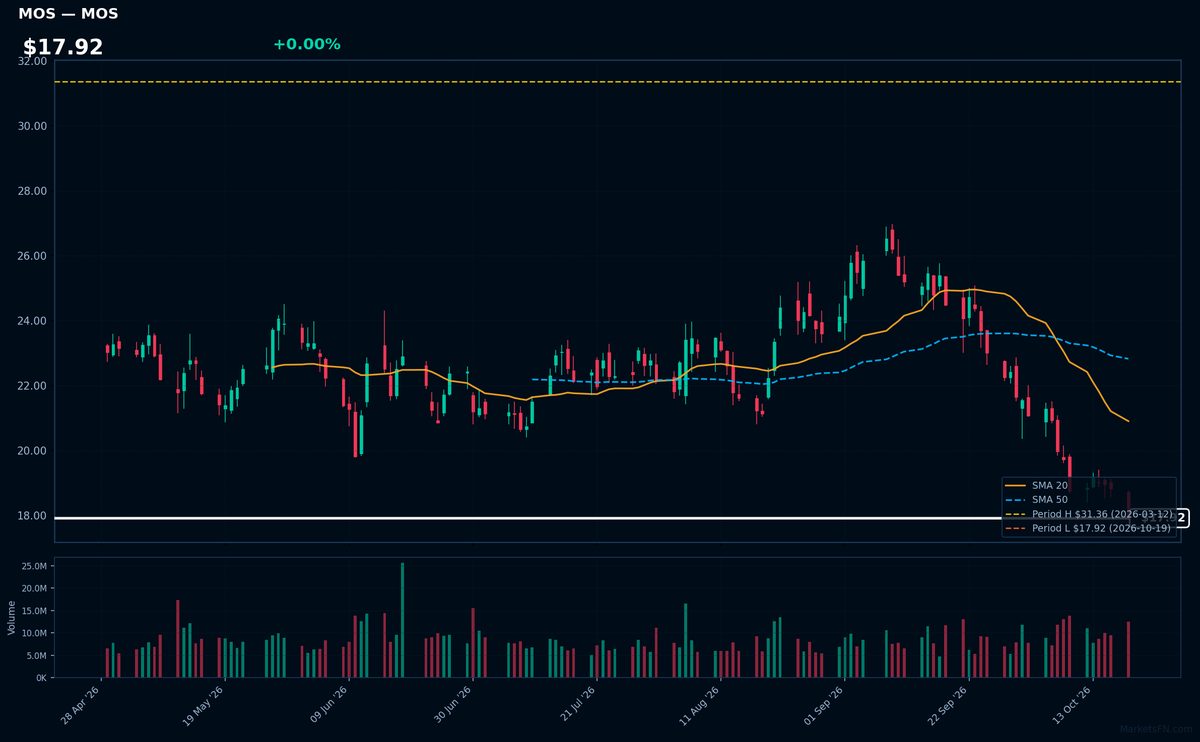
MOS | Mosaic Company | Basic Materials | Price Last: $17.92 | % Realized: -28.38% | RSI: 22.6 | % above MA200: -26.0% | Trend: Below MA20, MA50, MA200
Mosaic produces concentrated phosphate and potash crop nutrients, critical for global agriculture. Investors watch MOS as a pure-play fertilizer stock highly sensitive to crop prices and farm economics, with volatile earnings tied to commodity cycles.
Technically extreme: RSI 22.6 shows oversold conditions amid bearish MA alignment (price < MA20 < MA50 < MA200) and -28.4% YTD plunge to test 2026 lows — warning sign absent fundamental catalysts.
Market Commentary
The S&P 500 stocks trading near their 2026 highs—Berkshire Hathaway (BRK-B), Visa (V), McKesson (MCK), Elevance Health (ELV), and International Flavors & Fragrances (IFF)—reflect strong investor confidence in defensive sectors like healthcare, payments, and diversified conglomerates. These names are likely benefiting from stable earnings, resilient demand, and in some cases, inflation-resistant business models. Conversely, stocks near 2026 lows—Prologis (PLD), First Solar (FSLR), Paramount Skydance (PSKY), MGM Resorts (MGM), and Mosaic (MOS)—signal pressure in cyclical sectors such as real estate, renewables, entertainment, and commodities, where macroeconomic uncertainty or oversupply concerns may be weighing on sentiment.
The divergence highlights a cautious market favoring predictable cash flows over cyclical growth. Healthcare (MCK, ELV) and financial services (V) dominate the highs, while interest-rate-sensitive REITs (PLD) and discretionary spending-linked names (MGM, PSKY) lag. Commodity-linked MOS and solar play FSLR suggest sector-specific headwinds, including volatile input costs and policy risks. This aligns with a broader trend of defensive positioning amid lingering inflation and rate uncertainty.
Investors should monitor earnings revisions for high-flyers to confirm valuations are justified, while tracking macro indicators (rates, consumer spending) for potential rebounds in battered cyclicals. Sector rotation risks loom if economic data shifts; any Fed policy pivot or commodity price stabilization could revive interest in laggards like MOS or PLD. Discipline around entry points remains critical given the extremes.
Methodology: All 503 S&P 500 constituents screened. Close prices downloaded from 2026-01-01. Period high = highest close since Jan 1 2026; period low = lowest close since Jan 1 2026. Distance = (current price / period extreme − 1) × 100. Technical indicators computed on up to 1 year of daily OHLCV data.
Disclaimer: For informational purposes only. Not investment advice. Past performance is not indicative of future results.