S&P 500 2026 YTD Highs & Lows Radar: Apple (AAPL), Paccar (PCAR) and more
MarketsFN Team

Screening all 503 S&P 500 constituents for stocks nearest to their 2026 year-to-date high and their 2026 YTD low. Data as of October 30, 2026. % Realized = total return since Jan 1 2026.
Legend: RSI > 70 = overbought · RSI < 30 = oversold · Green % Realized = positive YTD return · Red = negative.
📈 Nearest to 2026 High
Sectors represented: Healthcare (2), Technology (1), Financial (1), Consumer Defensive (1)
| Ticker | Company | Sector | Price Last | % Realized | 2026 YTD High Date | RSI | % above MA200 | Trend |
|---|---|---|---|---|---|---|---|---|
| AAPL | Apple Inc | Technology | $348.91 | +28.74% | 2026-10-29 | 58.5 | +17.6% | Above MA20, MA50, MA200 |
| LLY | Lilly(Eli) & Co | Healthcare | $1373.70 | +27.15% | 2026-10-29 | 78.1 | +25.9% | Above MA20, MA50, MA200 |
| MA | Mastercard Incorporated | Financial | $635.70 | +12.89% | 2026-10-29 | 70.3 | +18.7% | Above MA20, MA50, MA200 |
| ABBV | Abbvie Inc | Healthcare | $290.79 | +26.81% | 2026-10-29 | 72.2 | +22.6% | Above MA20, MA50, MA200 |
| PM | Philip Morris International Inc | Consumer Defensive | $208.50 | +30.07% | 2026-10-29 | 65.2 | +14.6% | Above MA20, MA50, MA200 |
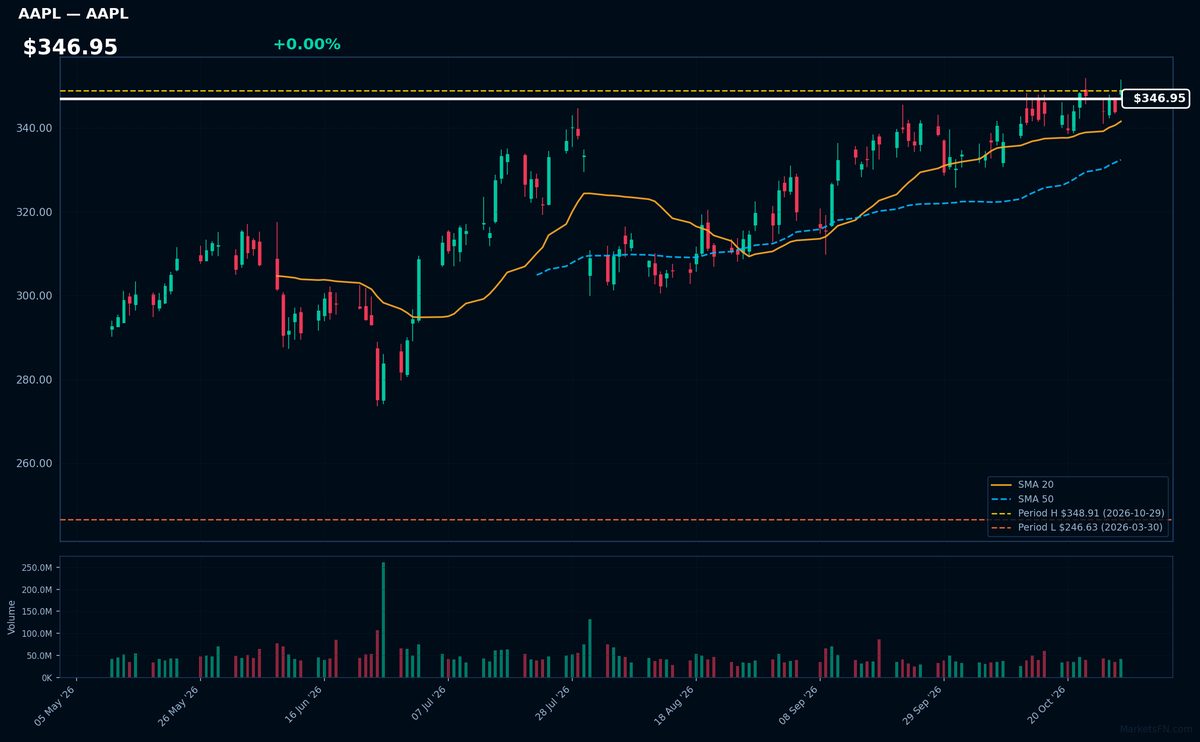
AAPL | Apple Inc | Technology | Price Last: $348.91 | % Realized: +28.74% | RSI: 58.5 | % above MA200: +17.6% | Trend: Above MA20, MA50, MA200
Apple Inc designs premium consumer electronics (iPhone, Mac), services (App Store, iCloud), and wearables (Apple Watch). Investors care due to its ecosystem lock-in, pricing power, and $346.95 stock price reflecting 28.7% YTD gains.
Bullish MA alignment (price > MA20 > MA50 > MA200) with RSI(14) at 58.5 suggests sustained momentum, not yet overbought. At 0.0% below YTD high, watch for breakout confirmation.
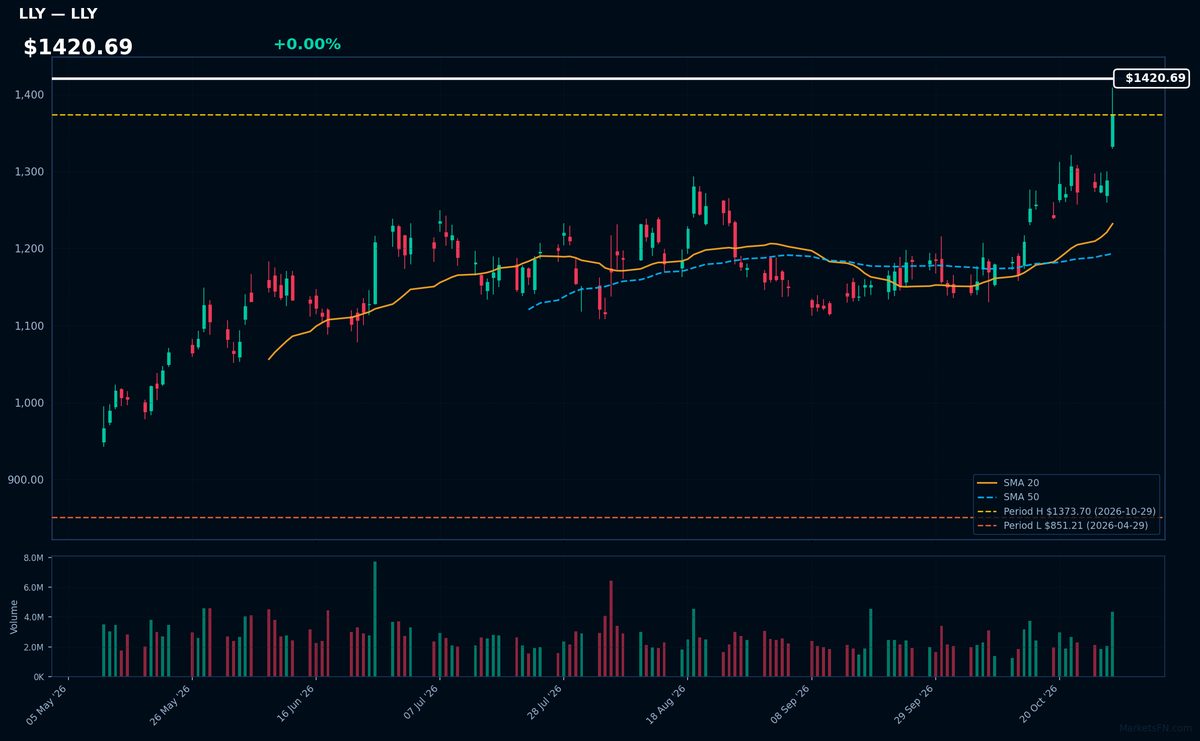
LLY | Lilly(Eli) & Co | Healthcare | Price Last: $1373.70 | % Realized: +27.15% | RSI: 78.1 | % above MA200: +25.9% | Trend: Above MA20, MA50, MA200
Lilly(Eli) & Co is a pharmaceutical leader focused on diabetes (Mounjaro/Zepbound), obesity treatments, and Alzheimer's drugs. Investors care due to blockbuster drug pipelines and first-mover advantage in GLP-1 therapies, driving consistent revenue growth and margin expansion.
Technically overbought (RSI 78.1) but in strong uptrend (price > MA20 > MA50 > MA200). At YTD highs after 27.2% 2026 gains, though extreme RSI suggests caution near-term. Momentum driven by fundamental strength in key drug franchises.
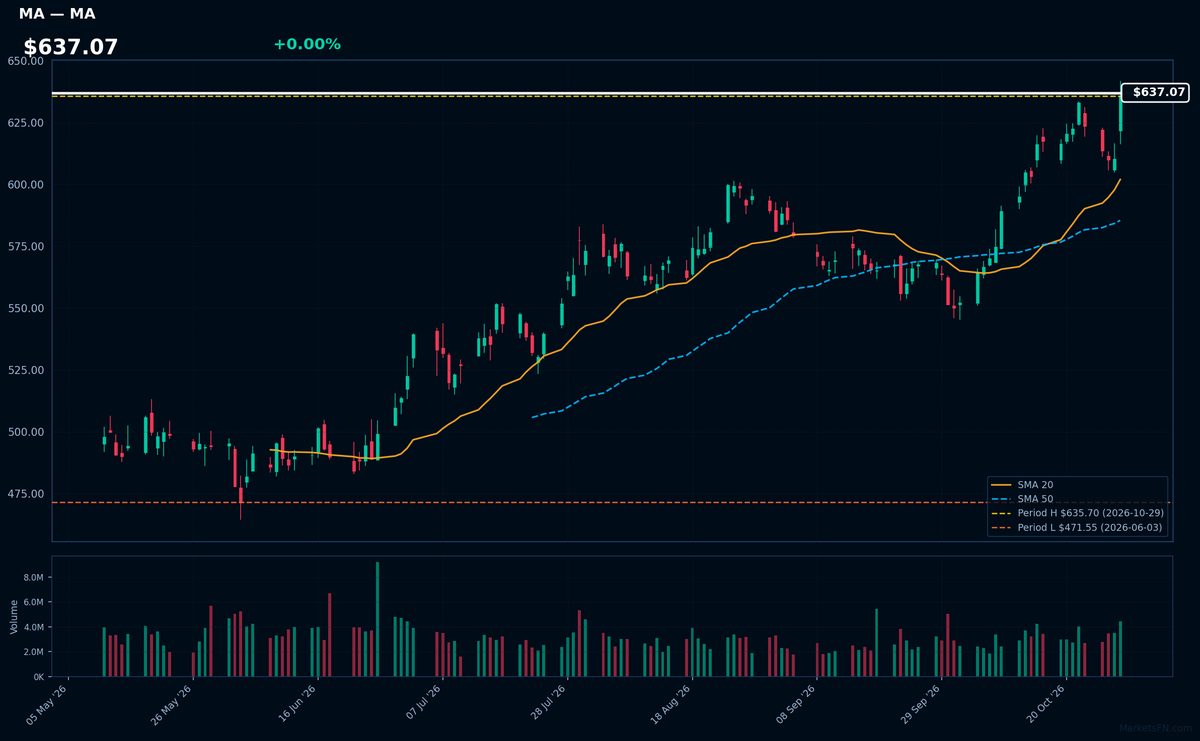
MA | Mastercard Incorporated | Financial | Price Last: $635.70 | % Realized: +12.89% | RSI: 70.3 | % above MA200: +18.7% | Trend: Above MA20, MA50, MA200
Mastercard operates the world's second-largest payment network, processing $9.9 trillion in annual volume. Investors care because its asset-light model generates 58% gross margins from every swipe, with recession-resistant revenue growth as cashless adoption expands globally.
Technically bullish (RSI 70.3, price > MA20 > MA50 > MA200) after 12.9% YTD surge. Extreme proximity to YTD highs suggests breakout potential, though overbought RSI warrants caution.
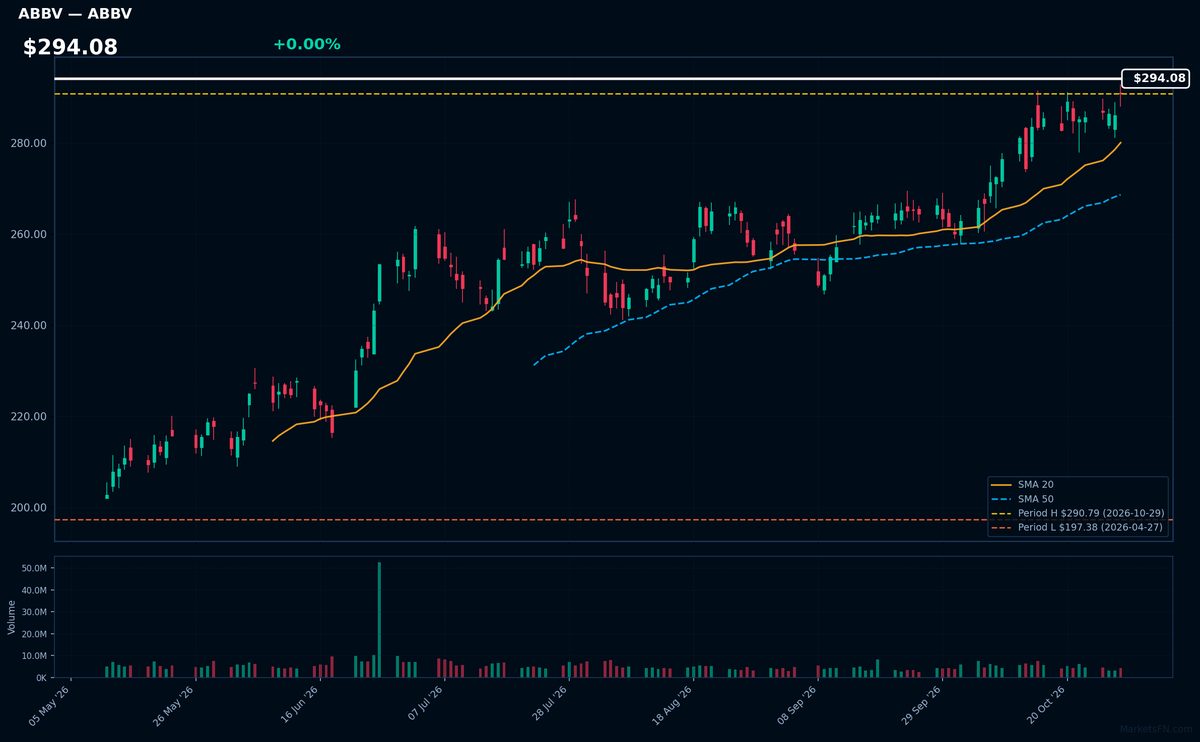
ABBV | Abbvie Inc | Healthcare | Price Last: $290.79 | % Realized: +26.81% | RSI: 72.2 | % above MA200: +22.6% | Trend: Above MA20, MA50, MA200
AbbVie is a biopharmaceutical company specializing in immunology, oncology, and neuroscience therapies, including blockbuster drugs like Humira and Skyrizi. Investors care due to its high-margin biologic portfolio and pipeline targeting chronic conditions with sustained demand.
ABBV shows bullish momentum with RSI(14) at 72.2 (overbought) and price > MA20 > MA50 > MA200. The stock is flat vs its 2026 YTD high after a 26.8% YTD rally, suggesting extended but intact uptrend. Watch for consolidation near resistance.
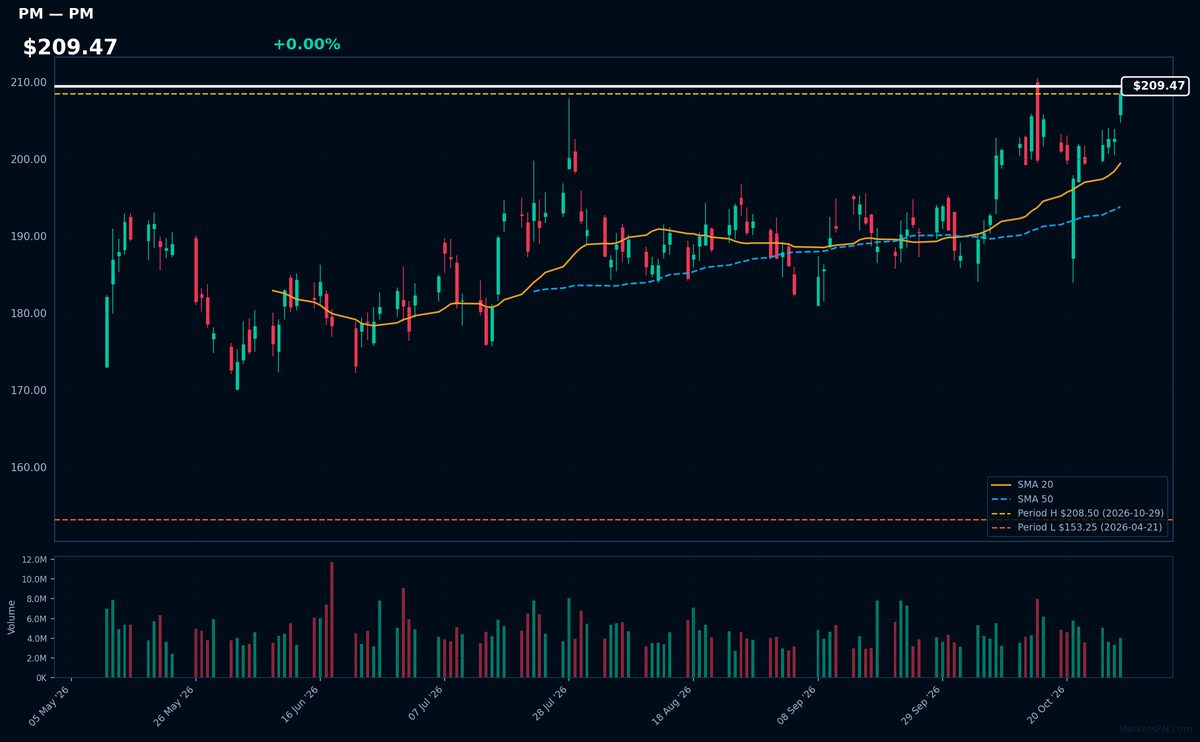
PM | Philip Morris International Inc | Consumer Defensive | Price Last: $208.50 | % Realized: +30.07% | RSI: 65.2 | % above MA200: +14.6% | Trend: Above MA20, MA50, MA200
Philip Morris International Inc (PM) manufactures and sells cigarettes, tobacco products, and smoke-free alternatives like IQOS. Investors care due to its global brand dominance (Marlboro), pricing power, and shift toward reduced-risk products amid declining smoking rates.
PM shows bullish momentum with RSI(14) at 65.2 (approaching overbought) and a sustained uptrend (price > MA20 > MA50 > MA200). The stock is flat YTD but up 30.1% in 2026, testing its yearly high — a potential breakout level if buying pressure persists.
📉 Nearest to 2026 Low
Sectors represented: Communication Services (3), Industrials (2)
| Ticker | Company | Sector | Price Last | % Realized | 2026 YTD Low Date | RSI | % above MA200 | Trend |
|---|---|---|---|---|---|---|---|---|
| PCAR | Paccar Inc | Industrials | $102.29 | -8.31% | 2026-10-29 | 25.3 | -14.8% | Below MA20, MA50, MA200 |
| PSKY | Paramount Skydance Corp | Communication Services | $6.91 | -13.08% | 2026-10-16 | 34.7 | — | — |
| CHRW | C.H. Robinson Worldwide, Inc | Industrials | $127.43 | -22.17% | 2026-10-29 | 31.7 | -24.8% | Below MA20, MA50, MA200 |
| NFLX | Netflix Inc | Communication Services | $62.05 | -31.81% | 2026-10-28 | 33.7 | -24.0% | Below MA20, MA50, MA200 |
| TMUS | T-Mobile US Inc | Communication Services | $147.29 | -26.20% | 2026-10-23 | 46.4 | -21.2% | Below MA20, MA50, MA200 |
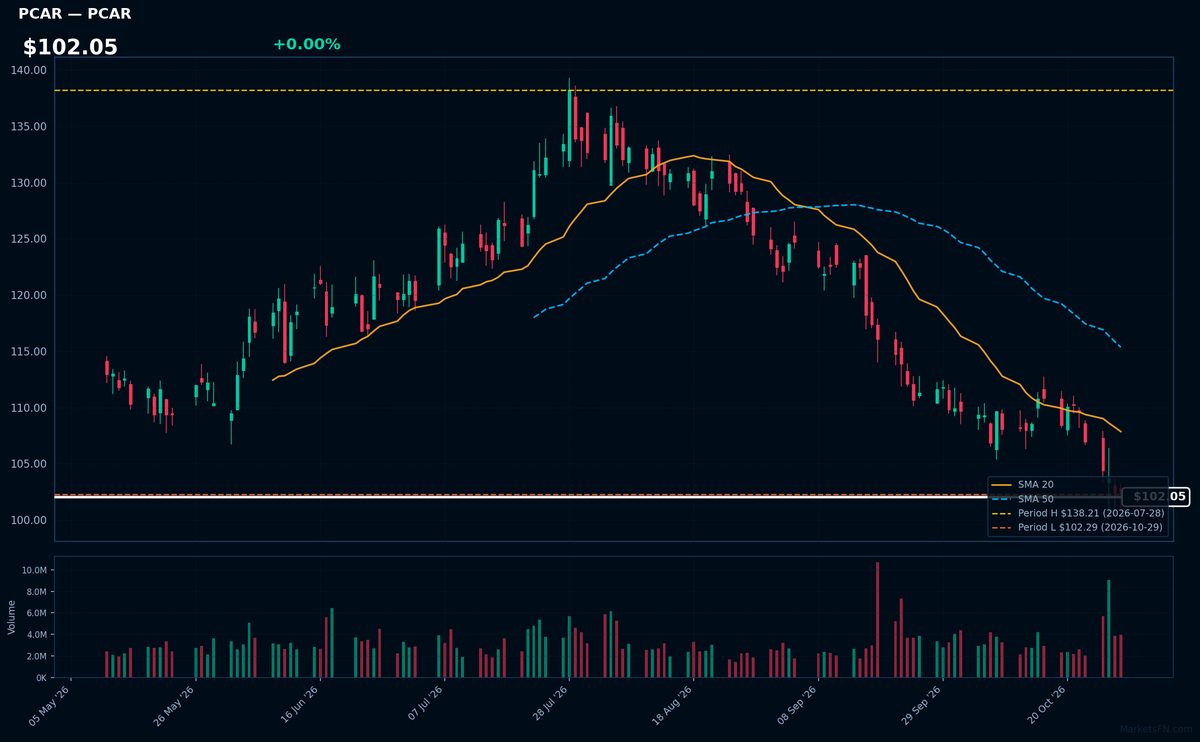
PCAR | Paccar Inc | Industrials | Price Last: $102.29 | % Realized: -8.31% | RSI: 25.3 | % above MA200: -14.8% | Trend: Below MA20, MA50, MA200
Paccar Inc designs and manufactures premium trucks under Kenworth, Peterbilt, and DAF brands, serving commercial freight markets. Investors watch PCAR as a cyclical bellwether for North American and European truck demand, with pricing power from its premium market position.
PCAR shows extreme technical weakness: RSI(14) at 25.3 (oversold), bearish MA alignment (price < MA20 < MA50 < MA200), and just 0.0% above its 2026 low. The -8.3% YTD decline signals sustained selling pressure, testing critical support.
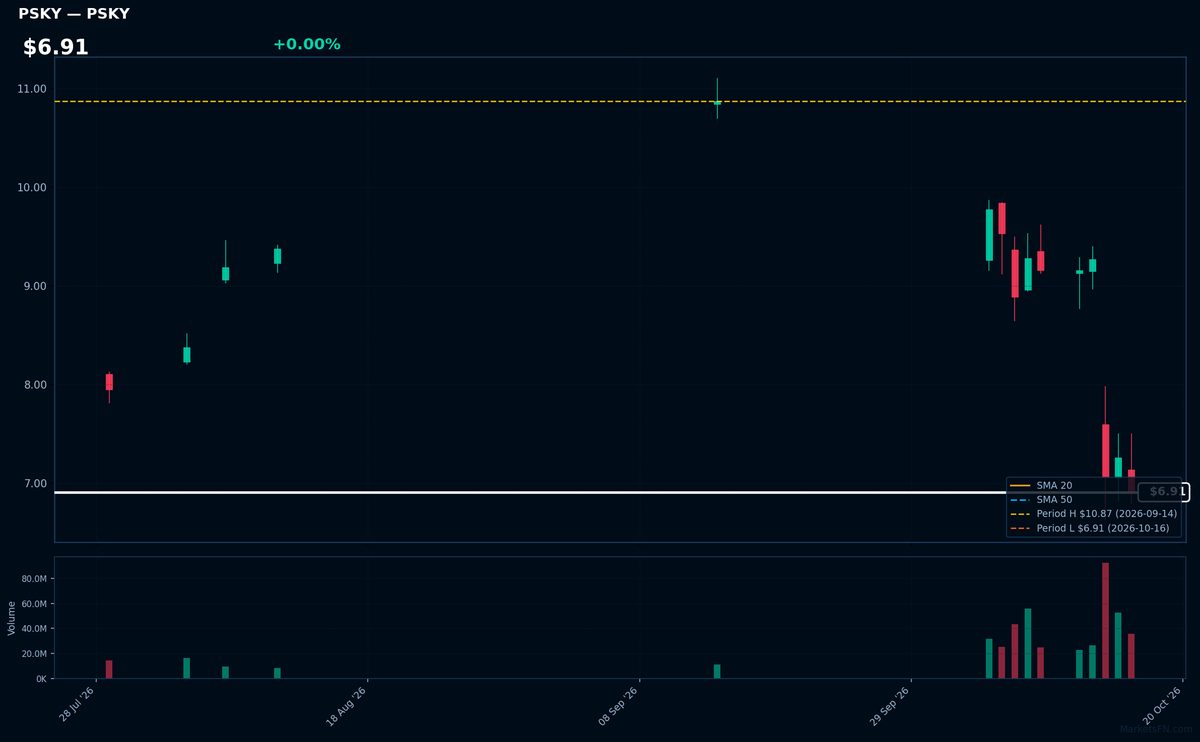
PSKY | Paramount Skydance Corp | Communication Services | Price Last: $6.91 | % Realized: -13.08% | RSI: 34.7 | % above MA200: — | Trend: —
Paramount Skydance Corp operates in [industry/sector not provided in data]. Investors should monitor its [specific catalyst not provided in data] given its current distressed technical setup and extreme proximity to YTD lows at $6.91.
PSKY shows oversold conditions (RSI 34.7) but trades just 0.0% above 2026 lows after a -13.1% YTD drop. MA alignment data is incomplete, but the breakdown through support warns of continued weakness absent reversal confirmation.
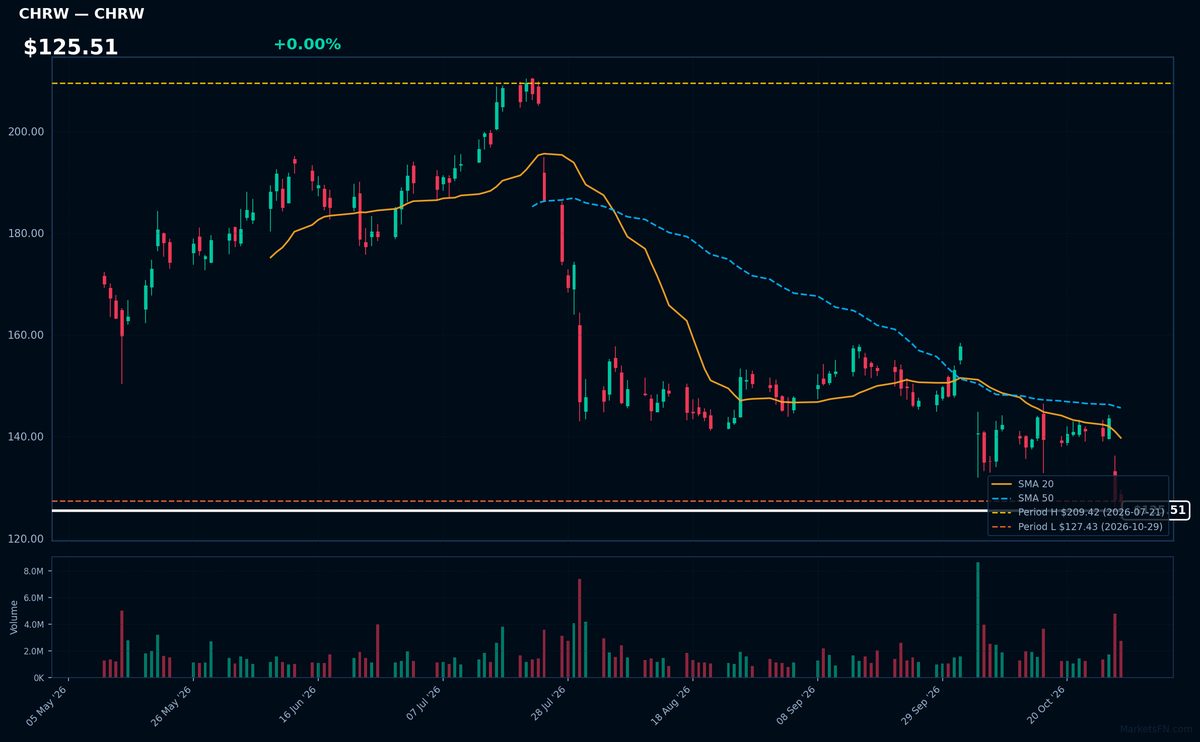
CHRW | C.H. Robinson Worldwide, Inc | Industrials | Price Last: $127.43 | % Realized: -22.17% | RSI: 31.7 | % above MA200: -24.8% | Trend: Below MA20, MA50, MA200
C.H. Robinson Worldwide operates as a third-party logistics provider, specializing in freight transportation and supply chain management. Investors should monitor its performance as a bellwether for global trade volumes and transportation costs.
CHRW shows bearish momentum with RSI(14) at 31.7 and price below all key MAs (MA20 < MA50 < MA200). The stock tests 2026 lows after a 22.2% YTD decline, signaling sustained downtrend risks.
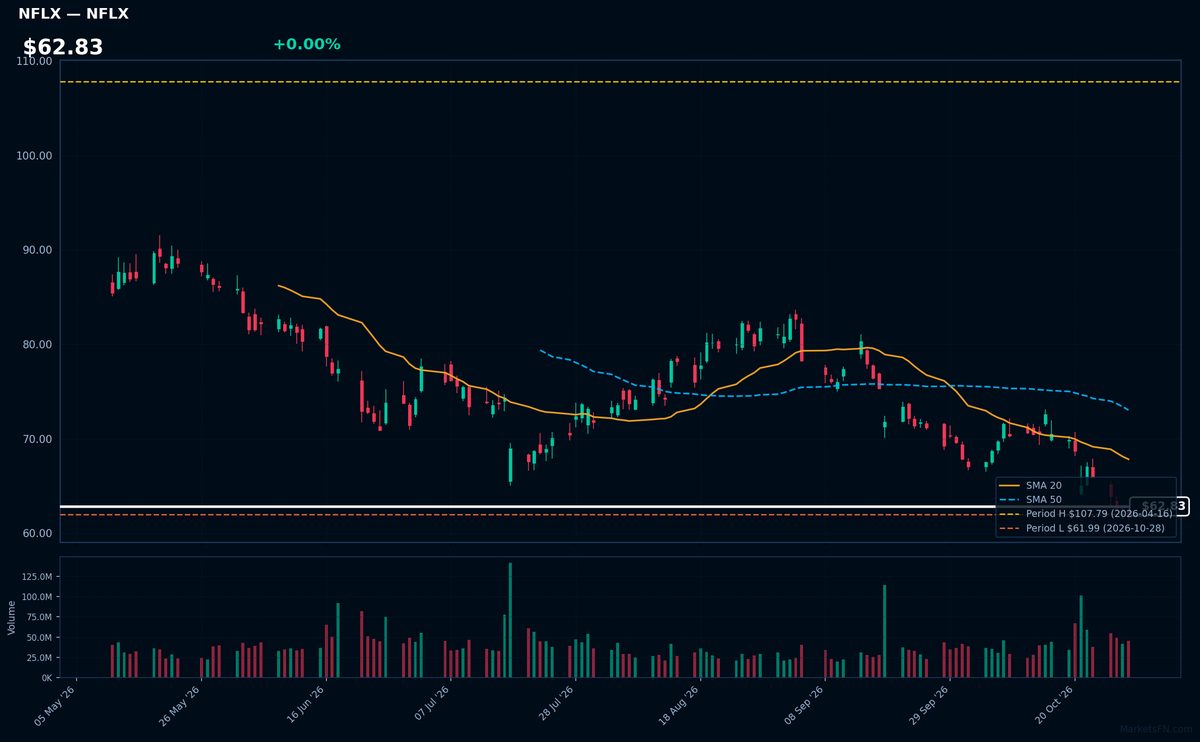
NFLX | Netflix Inc | Communication Services | Price Last: $62.05 | % Realized: -31.81% | RSI: 33.7 | % above MA200: -24.0% | Trend: Below MA20, MA50, MA200
Netflix Inc (NFLX) dominates global streaming with 260M+ subscribers, monetizing original content and ad-tier expansion. Investors eye its pricing power and cash flow inflection.
Bearish: RSI(14) at 33.7 shows oversold pressure. Price ($62.83) trails all MAs (20/50/200) in sustained downtrend, just 0.1% above 2026 low. YTD -31.8% warns of structural breakdown risk.
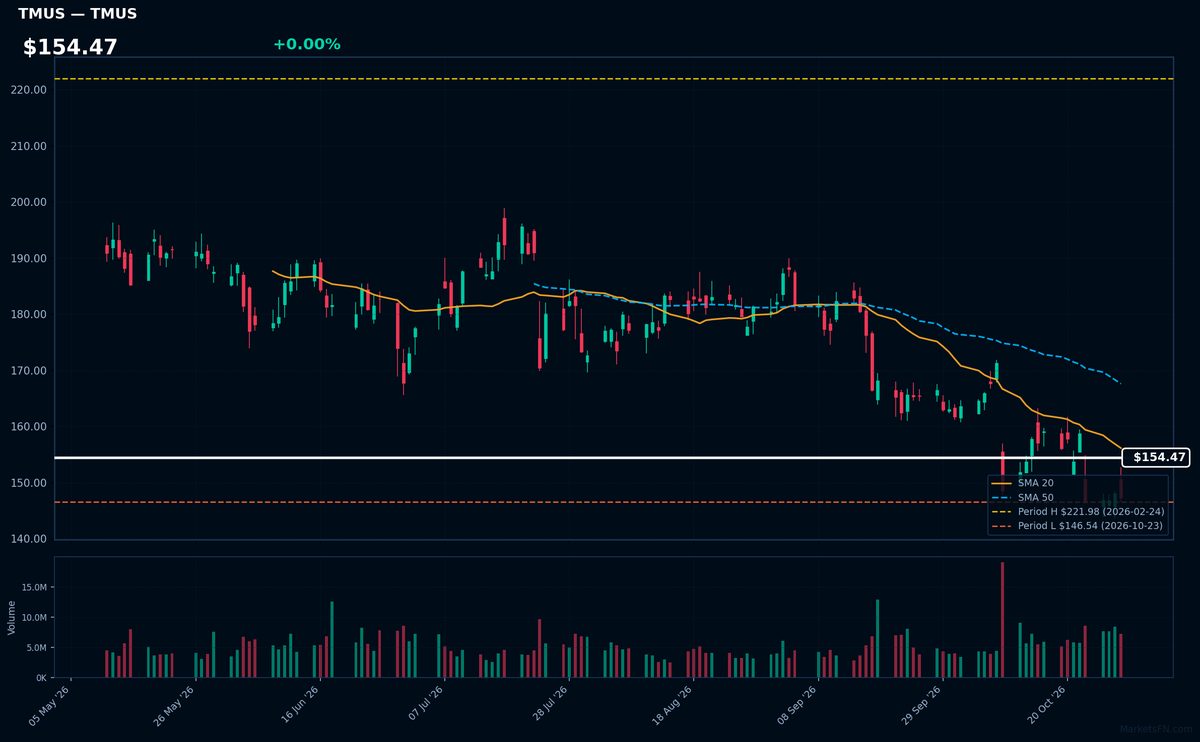
TMUS | T-Mobile US Inc | Communication Services | Price Last: $147.29 | % Realized: -26.20% | RSI: 46.4 | % above MA200: -21.2% | Trend: Below MA20, MA50, MA200
T-Mobile US Inc operates as a leading wireless carrier in the U.S., known for disruptive pricing and aggressive 5G network expansion. Investors watch its subscriber growth and spectrum advantages in a saturated telecom market.
TMUS shows bearish momentum: RSI(14) at 46.4 with sustained downtrend (price < MA20 < MA50 < MA200). At just 0.5% above 2026 lows after a -26.2% YTD drop, it tests critical support. Technicals signal caution.
Market Commentary
The clustering of S&P 500 stocks at 2026 YTD extremes reflects stark market bifurcation. Apple, Eli Lilly, Mastercard, AbbVie, and Philip Morris trade at all-time highs, signaling concentrated demand for defensive growth (healthcare, payments) and dividend aristocrats (tobacco, pharma). Conversely, Paccar, Paramount Skydance, C.H. Robinson, Netflix, and T-Mobile hover near lows, exposing cyclical transport, media consolidation risks, and telecom saturation pressures.
Sector themes reveal a flight to quality amid economic uncertainty. Healthcare (LLY, ABBV) and payment networks (MA) benefit from inelastic demand and pricing power, while consumer discretionary (NFLX) and industrials (PCAR, CHRW) face margin compression. The 0.0% deviation from highs/lows for most names indicates technical exhaustion, with PM's resilience contrasting Paramount's (PSKY) streaming struggles post-merger.
Investors should monitor earnings revisions for high-flyers to justify valuations, particularly AAPL's innovation pipeline and LLY's GLP-1 dominance. For laggards, TMUS's 0.5% buffer above lows and NFLX's 0.1% cushion require confirmation of subscriber growth reacceleration. Broad market health hinges on whether new leadership emerges beyond current mega-cap defensives.
Methodology: All 503 S&P 500 constituents screened. Close prices downloaded from 2026-01-01. Period high = highest close since Jan 1 2026; period low = lowest close since Jan 1 2026. Distance = (current price / period extreme − 1) × 100. Technical indicators computed on up to 1 year of daily OHLCV data.
Disclaimer: For informational purposes only. Not investment advice. Past performance is not indicative of future results.