Ripple Struggles at $1.42 as RSI Nears Overbought Zone
QuoteReporter
•3 min read
Ripple Struggles at $1.42 as RSI Nears Overbought Zone
Ripple (XRP/USD) | August 28, 2026 $1.4167 -2.50%
🔍 Technical Analysis
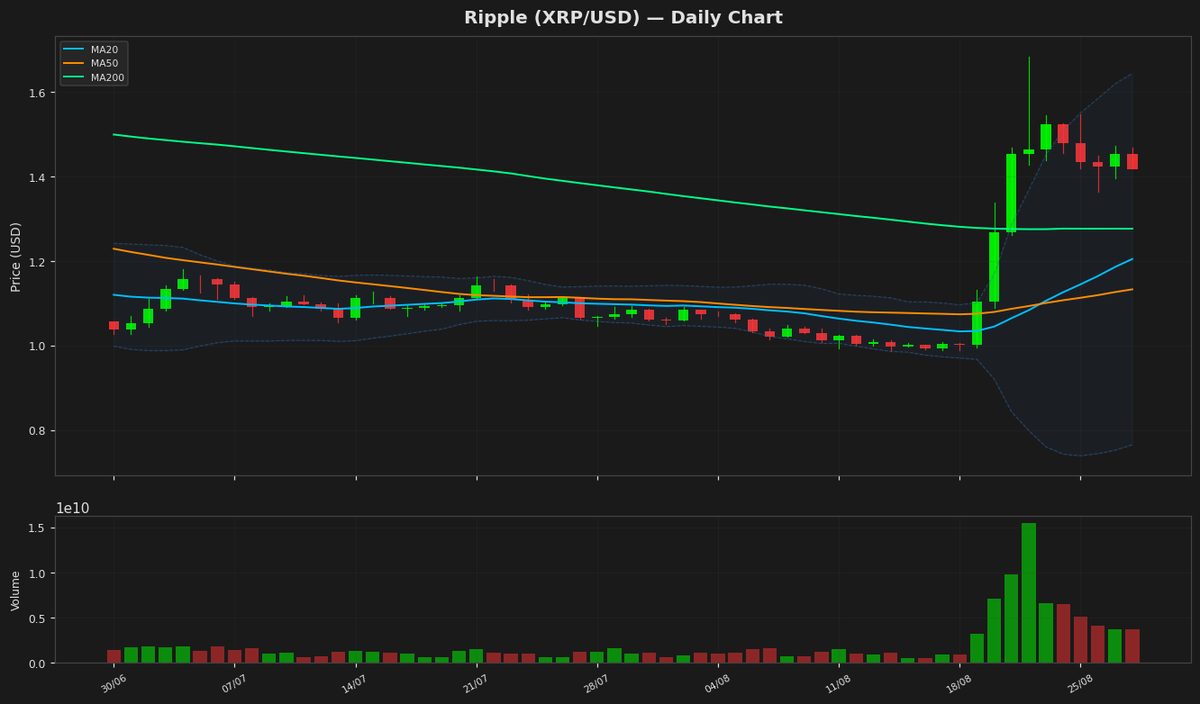
Ripple (XRP) is currently trading at $1.416700, reflecting a daily decline of 2.50%. The price remains above all key moving averages, with the MA20 at 1.204361, MA50 at 1.13254, and MA200 at 1.27605, indicating a bullish trend in the medium to long term. The Bollinger Bands show an upper band at 1.643851 and a lower band at 0.764871, suggesting moderate volatility. The current price is closer to the upper band, which may signal overbought conditions. The RSI(14) stands at 79.390927, deep in overbought territory, indicating potential for a short-term pullback or consolidation. The MACD line at 0.107251 is above the signal line at 0.0782, reinforcing bullish momentum, though divergence should be monitored for weakening trends. The ATR(14) of 0.101208 reflects moderate price volatility. Key resistance levels to watch include the 52-week high at 2.41026402 and the YTD high at the same level. Immediate support lies near the MA20 at 1.204361, followed by the MA50 at 1.13254. A break below these levels could signal a deeper correction. The 52-week low at 0.98842198 and YTD low at the same level serve as critical long-term support. Traders should watch for RSI cooling and MACD convergence for potential trend reversals.
Technical Metrics
| Metric | Value |
|---|---|
| Current Price | $1.4167 |
| Daily Change | -2.50% |
| MA 20 | $1.2044 |
| % from MA20 | +17.63% |
| MA 50 | $1.1325 |
| % from MA50 | +25.09% |
| MA 200 | $1.2760 |
| % from MA200 | +11.02% |
| BB Upper | $1.6439 |
| % from BB Upper | -13.82% |
| BB Lower | $0.7649 |
| % from BB Lower | +85.22% |
| RSI (14) | 79.39 |
| MACD | 0.107251 |
| MACD Signal | 0.078200 |
| ATR (14) | 0.101208 |
| 3-Day High | $1.4724 |
| 3-Day Low | $1.3632 |
| 52-Week High | $2.4103 |
| % from 52W High | -41.22% |
| 52-Week Low | $0.9884 |
| % from 52W Low | +43.33% |
| YTD High | $2.4103 |
| % from YTD High | -41.22% |
| YTD Low | $0.9884 |
| % from YTD Low | +43.33% |
📊 Market Commentary
Ripple (XRP) is currently trading at $1.4167, down 2.50% today, as the broader cryptocurrency market experiences mild consolidation. Despite the daily dip, XRP remains in a strong position, with its Relative Strength Index (RSI) at 79.4, indicating overbought conditions. This suggests that while bullish momentum has been dominant, traders should remain cautious for potential short-term pullbacks. Over the past 52 weeks, XRP has traded between $0.9884 and $2.4103, reflecting significant volatility and renewed interest in the asset, particularly amid developments in Ripple’s ongoing legal case with the U.S. SEC.
Market sentiment around XRP remains cautiously optimistic, with traders closely monitoring key resistance and support levels. The immediate resistance lies near $1.50, a psychological barrier that, if broken, could pave the way for a retest of higher levels. On the downside, $1.30 serves as a critical support zone, holding importance as a previous consolidation area. A break below this level could signal a deeper correction.
Traders are also watching trading volume trends, as sustained high volume could validate the current price action. Additionally, regulatory updates regarding Ripple’s legal proceedings continue to influence investor confidence. While the RSI suggests overheating, the broader trend remains upward, provided key support levels hold. For now, market participants are balancing optimism with technical caution, awaiting clearer signals for XRP’s next directional move.
Market sentiment around XRP remains cautiously optimistic, with traders closely monitoring key resistance and support levels. The immediate resistance lies near $1.50, a psychological barrier that, if broken, could pave the way for a retest of higher levels. On the downside, $1.30 serves as a critical support zone, holding importance as a previous consolidation area. A break below this level could signal a deeper correction.
Traders are also watching trading volume trends, as sustained high volume could validate the current price action. Additionally, regulatory updates regarding Ripple’s legal proceedings continue to influence investor confidence. While the RSI suggests overheating, the broader trend remains upward, provided key support levels hold. For now, market participants are balancing optimism with technical caution, awaiting clearer signals for XRP’s next directional move.
Disclaimer
The content on MarketsFN.com is provided for educational and informational purposes only. It does not constitute financial advice or investment recommendations. All investments involve risk. Cryptocurrency markets are highly volatile. Past performance does not guarantee future results.