Tron RSI at 37.8: Bullish Reversal Ahead at $0.3315?
QuoteReporter
•2 min read
Tron (TRX/USD) | October 12, 2026 $0.3315 +0.48%
🔍 Technical Analysis
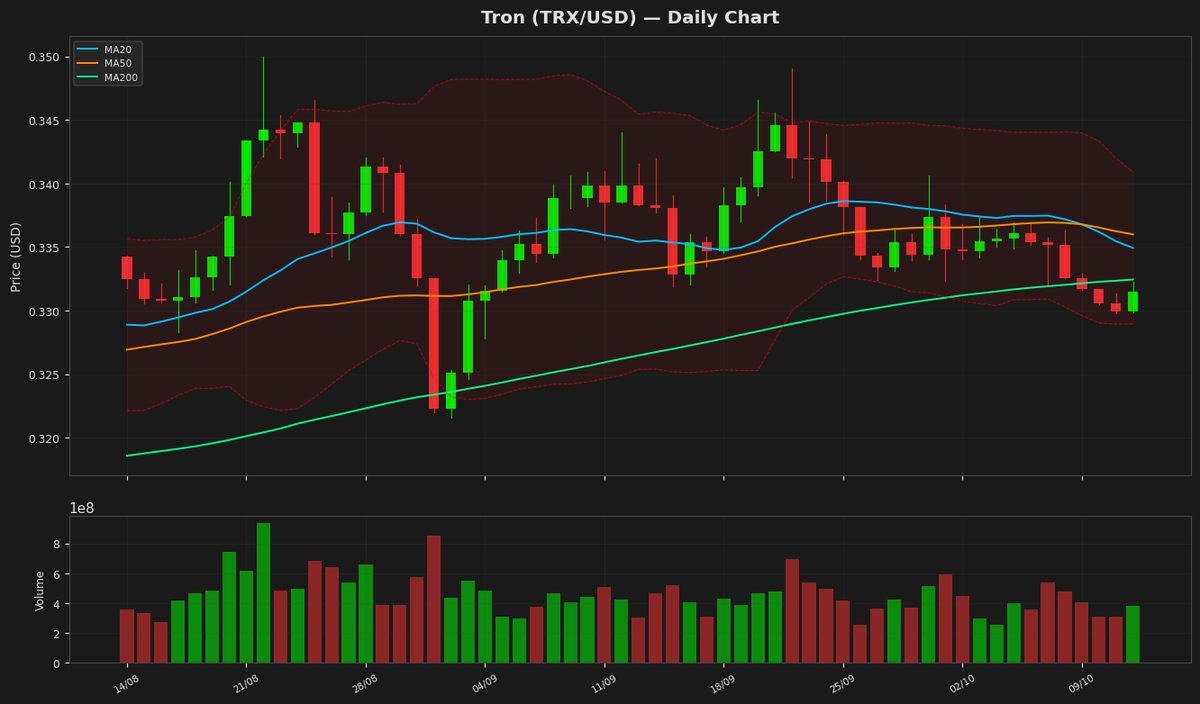
Tron (TRX) is currently trading at $0.331506, showing a marginal daily gain of 0.48%. The price remains below key moving averages, with the 20-day MA at $0.334928, the 50-day MA at $0.335992, and the 200-day MA at $0.332441, indicating a bearish near-term trend. Bollinger Bands show the upper band at $0.340907 and the lower band at $0.32895, with the price hovering near the lower band, suggesting potential oversold conditions. The RSI(14) at 37.769802 is nearing oversold territory but has not yet signaled a reversal. The MACD histogram is negative at -0.001491, with the signal line at -0.000879, reinforcing bearish momentum. The ATR(14) of $0.002848 indicates low volatility. Key support levels are at the yearly low of $0.26813799 and the lower Bollinger Band, while resistance lies at the 20-day MA and upper Bollinger Band. The 52-week high of $0.37633201 remains a critical resistance level. TRX needs to break above the moving averages to shift sentiment bullish, but current indicators suggest continued consolidation or downside pressure unless buying volume increases.
Technical Metrics
| Metric | Value |
|---|---|
| Current Price | $0.3315 |
| Daily Change | +0.48% |
| MA 20 | $0.3349 |
| % from MA20 | -1.02% |
| MA 50 | $0.3360 |
| % from MA50 | -1.34% |
| MA 200 | $0.3324 |
| % from MA200 | -0.28% |
| BB Upper | $0.3409 |
| % from BB Upper | -2.76% |
| BB Lower | $0.3290 |
| % from BB Lower | +0.78% |
| RSI (14) | 37.77 |
| MACD | -0.001491 |
| MACD Signal | -0.000879 |
| ATR (14) | 0.002848 |
| 3-Day High | $0.3323 |
| 3-Day Low | $0.3298 |
| 52-Week High | $0.3763 |
| % from 52W High | -11.91% |
| 52-Week Low | $0.2681 |
| % from 52W Low | +23.63% |
| YTD High | $0.3763 |
| % from YTD High | -11.91% |
| YTD Low | $0.2681 |
| % from YTD Low | +23.63% |
📊 Market Commentary
Tron (TRX) is currently trading at $0.3315, up 0.48% today, as the broader crypto market shows cautious optimism. The Relative Strength Index (RSI) at 37.8 suggests TRX is approaching oversold territory, which could indicate potential for a short-term rebound if buying pressure increases. However, the lack of strong momentum keeps traders wary, with the price still well within its 52-week range of $0.2681 to $0.3763.
Market sentiment around TRX remains mixed. While the network continues to see steady adoption in decentralized applications (dApps) and stablecoin transactions, particularly USDT on the Tron blockchain, broader macroeconomic uncertainty and fluctuating Bitcoin dominance have kept TRX in a consolidation phase. Traders are closely watching key support near $0.32, which has held multiple times in recent weeks, while resistance at $0.35 remains a critical level to break for a stronger upward move.
Volume has been relatively subdued, suggesting a lack of strong conviction from either bulls or bears. Institutional interest in TRX remains limited compared to larger altcoins, keeping price action largely retail-driven. With no major network upgrades or external catalysts in the immediate horizon, TRX's near-term trajectory will likely depend on broader market trends and Bitcoin's performance. Traders are monitoring the RSI for potential divergence signals and any shift in trading volume that could indicate a breakout or breakdown.
Market sentiment around TRX remains mixed. While the network continues to see steady adoption in decentralized applications (dApps) and stablecoin transactions, particularly USDT on the Tron blockchain, broader macroeconomic uncertainty and fluctuating Bitcoin dominance have kept TRX in a consolidation phase. Traders are closely watching key support near $0.32, which has held multiple times in recent weeks, while resistance at $0.35 remains a critical level to break for a stronger upward move.
Volume has been relatively subdued, suggesting a lack of strong conviction from either bulls or bears. Institutional interest in TRX remains limited compared to larger altcoins, keeping price action largely retail-driven. With no major network upgrades or external catalysts in the immediate horizon, TRX's near-term trajectory will likely depend on broader market trends and Bitcoin's performance. Traders are monitoring the RSI for potential divergence signals and any shift in trading volume that could indicate a breakout or breakdown.
Disclaimer
The content on MarketsFN.com is provided for educational and informational purposes only. It does not constitute financial advice or investment recommendations. All investments involve risk. Cryptocurrency markets are highly volatile. Past performance does not guarantee future results.