Ripple Holds Steady at $1.46 as RSI Nears Midpoint
QuoteReporter
•2 min read
Ripple Holds Steady at $1.46 as RSI Nears Midpoint
Ripple (XRP/USD) | September 04, 2026 $1.4556 +0.29%
🔍 Technical Analysis
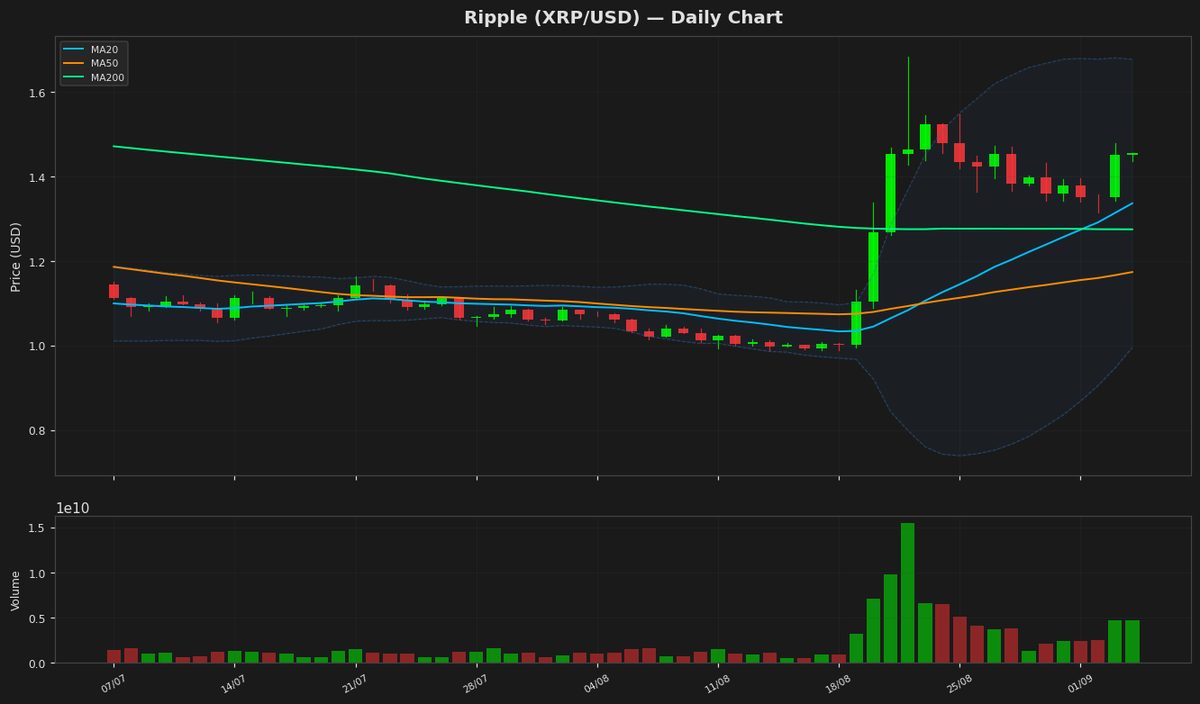
Ripple (XRP) is currently trading at $1.455600, showing a modest daily gain of 0.29%. The price remains above key moving averages, with the 20-day MA at $1.336155, the 50-day MA at $1.173485, and the 200-day MA at $1.274558, indicating a bullish trend in the medium to long term. The Bollinger Bands suggest moderate volatility, with the upper band at $1.677047 and the lower band at $0.995262, placing the current price near the middle band, signaling a neutral stance. The RSI(14) at 50.19 reflects balanced momentum, neither overbought nor oversold. The MACD line at 0.079129 is slightly below the signal line at 0.081597, hinting at potential short-term consolidation or a minor bearish crossover. The ATR(14) of 0.088567 indicates relatively low volatility. Key resistance levels to watch are the yearly high of $2.41026402 and the upper Bollinger Band, while immediate support lies near the 20-day MA and the yearly low of $0.98842198. A breakout above the upper Bollinger Band could signal renewed bullish momentum, whereas a drop below the 20-day MA may test lower support levels.
Technical Metrics
| Metric | Value |
|---|---|
| Current Price | $1.4556 |
| Daily Change | +0.29% |
| MA 20 | $1.3362 |
| % from MA20 | +8.94% |
| MA 50 | $1.1735 |
| % from MA50 | +24.04% |
| MA 200 | $1.2746 |
| % from MA200 | +14.20% |
| BB Upper | $1.6770 |
| % from BB Upper | -13.20% |
| BB Lower | $0.9953 |
| % from BB Lower | +46.25% |
| RSI (14) | 50.19 |
| MACD | 0.079129 |
| MACD Signal | 0.081597 |
| ATR (14) | 0.088567 |
| 3-Day High | $1.4792 |
| 3-Day Low | $1.3136 |
| 52-Week High | $2.4103 |
| % from 52W High | -39.61% |
| 52-Week Low | $0.9884 |
| % from 52W Low | +47.27% |
| YTD High | $2.4103 |
| % from YTD High | -39.61% |
| YTD Low | $0.9884 |
| % from YTD Low | +47.27% |
📊 Market Commentary
Ripple (XRP) is currently trading at $1.4556, showing modest gains of 0.29% today as the broader cryptocurrency market remains cautiously steady. The Relative Strength Index (RSI) at 50.2 indicates neutral momentum, suggesting neither overbought nor oversold conditions. Over the past 52 weeks, XRP has fluctuated between a low of $0.9884 and a high of $2.4103, reflecting significant volatility amid shifting regulatory and macroeconomic conditions.
Market sentiment around XRP remains mixed, influenced by ongoing legal developments between Ripple Labs and the U.S. Securities and Exchange Commission (SEC). Traders are closely monitoring any updates in the case, as clarity on XRP’s regulatory status could impact liquidity and institutional interest. Key resistance levels to watch include $1.50, a psychological barrier, followed by the $1.75 zone, where previous selling pressure emerged. On the downside, support lies near $1.30, with stronger defense around the $1.20 level, which has historically acted as a buying zone.
Volume trends and Bitcoin’s price action remain critical for XRP’s near-term direction, as altcoins often follow BTC’s lead. Additionally, traders are assessing broader market factors, including macroeconomic data and Federal Reserve policy signals, which could influence risk appetite. While XRP’s neutral RSI suggests a balanced market, breakouts or breakdowns from its current range will likely depend on external catalysts rather than technical factors alone.
Market sentiment around XRP remains mixed, influenced by ongoing legal developments between Ripple Labs and the U.S. Securities and Exchange Commission (SEC). Traders are closely monitoring any updates in the case, as clarity on XRP’s regulatory status could impact liquidity and institutional interest. Key resistance levels to watch include $1.50, a psychological barrier, followed by the $1.75 zone, where previous selling pressure emerged. On the downside, support lies near $1.30, with stronger defense around the $1.20 level, which has historically acted as a buying zone.
Volume trends and Bitcoin’s price action remain critical for XRP’s near-term direction, as altcoins often follow BTC’s lead. Additionally, traders are assessing broader market factors, including macroeconomic data and Federal Reserve policy signals, which could influence risk appetite. While XRP’s neutral RSI suggests a balanced market, breakouts or breakdowns from its current range will likely depend on external catalysts rather than technical factors alone.
Disclaimer
The content on MarketsFN.com is provided for educational and informational purposes only. It does not constitute financial advice or investment recommendations. All investments involve risk. Cryptocurrency markets are highly volatile. Past performance does not guarantee future results.