Tron Struggles at $0.33 as RSI Nears Oversold Zone
QuoteReporter
•2 min read
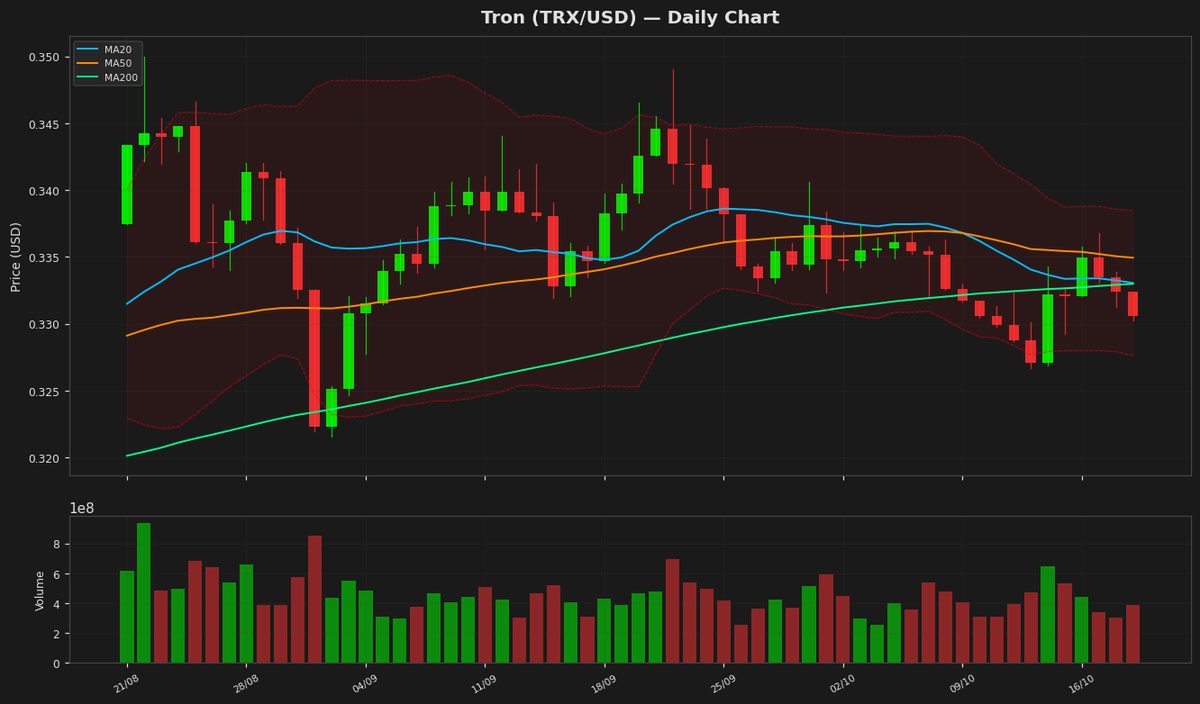
Tron (TRX/USD) | October 19, 2026 $0.3306 -0.55%
🔍 Technical Analysis
Tron (TRX) is currently trading at $0.330566, down 0.55% on the day, showing mild bearish momentum. The price is hovering near the lower Bollinger Band at $0.32761, indicating potential oversold conditions, while the upper band sits at $0.338475. The 20-day moving average (MA20) at $0.333043 and the 50-day moving average (MA50) at $0.334933 are both above the current price, suggesting short-term resistance. The 200-day moving average (MA200) at $0.332978 is nearly aligned with the MA20, reinforcing a neutral-to-bearish bias. The RSI(14) at 37.1 reflects weakening momentum but has not yet entered oversold territory. The MACD histogram shows a slight bearish crossover, with the MACD line (-0.001178) below the signal line (-0.001264), indicating subdued buying pressure. Key support levels to watch include the yearly low at $0.26813799 and the 52-week low at $0.27382699, while resistance is marked by the 52-week high at $0.37633201 and the YTD high at the same level. The Average True Range (ATR) of 0.00311 suggests low volatility. A break below the lower Bollinger Band could signal further downside, while reclaiming the MA20 may shift sentiment to neutral.
Technical Metrics
| Metric | Value |
|---|---|
| Current Price | $0.3306 |
| Daily Change | -0.55% |
| MA 20 | $0.3330 |
| % from MA20 | -0.74% |
| MA 50 | $0.3349 |
| % from MA50 | -1.30% |
| MA 200 | $0.3330 |
| % from MA200 | -0.72% |
| BB Upper | $0.3385 |
| % from BB Upper | -2.34% |
| BB Lower | $0.3276 |
| % from BB Lower | +0.90% |
| RSI (14) | 37.10 |
| MACD | -0.001178 |
| MACD Signal | -0.001264 |
| ATR (14) | 0.003110 |
| 3-Day High | $0.3367 |
| 3-Day Low | $0.3303 |
| 52-Week High | $0.3763 |
| % from 52W High | -12.16% |
| 52-Week Low | $0.2738 |
| % from 52W Low | +20.72% |
| YTD High | $0.3763 |
| % from YTD High | -12.16% |
| YTD Low | $0.2681 |
| % from YTD Low | +23.28% |
📊 Market Commentary
**Tron (TRX) Market Commentary**
Tron (TRX) is currently trading at $0.3306, down 0.55% today, as the broader cryptocurrency market shows mixed sentiment. The Relative Strength Index (RSI) at 37.1 suggests TRX is approaching oversold territory, which could attract buyers if the trend continues. Over the past 52 weeks, TRX has fluctuated between $0.2738 and $0.3763, with the current price sitting closer to the mid-range.
Market sentiment for TRX appears cautious, as traders weigh macroeconomic factors and network activity. Tron’s high throughput and low transaction fees continue to support its utility in decentralized applications (dApps) and stablecoin transfers, but recent price action reflects subdued demand. Key support levels to watch include the psychological $0.30 mark and the yearly low of $0.2738, while resistance lies near the upper boundary of $0.3763.
Traders are monitoring trading volume and network adoption for signs of renewed momentum. A sustained RSI rebound above 40 could signal short-term bullish interest, while a drop below $0.30 may trigger further downside pressure. Given its established use case in stablecoin transactions, TRX remains a focus for those tracking blockchain efficiency, though broader market trends will likely dictate near-term price action. For now, the market appears to be in a holding pattern, awaiting clearer directional cues.
Disclaimer
The content on MarketsFN.com is provided for educational and informational purposes only. It does not constitute financial advice or investment recommendations. All investments involve risk. Cryptocurrency markets are highly volatile. Past performance does not guarantee future results.