Ripple Dips to $1.5064 as RSI Nears Oversold Zone
QuoteReporter
•3 min read
Ripple Dips to $1.5064 as RSI Nears Oversold Zone
Ripple (XRP/USD) | October 06, 2026 $1.5064 -0.07%
🔍 Technical Analysis
**Technical Analysis of Ripple (XRP)**
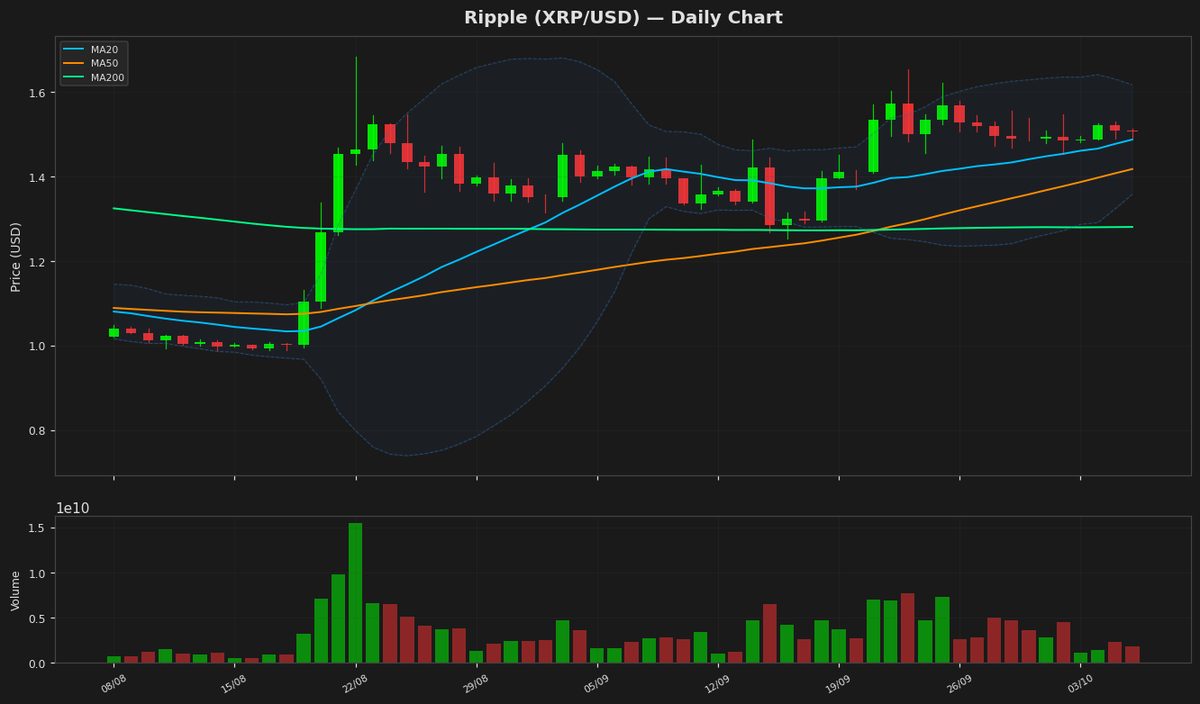
Ripple (XRP) is currently trading at $1.5064, showing minimal daily movement with a slight decline of 0.07%. The price remains above key moving averages, with the 20-day MA at $1.4870, the 50-day MA at $1.4172, and the 200-day MA at $1.2801, indicating a bullish long-term trend despite recent consolidation. Bollinger Bands suggest moderate volatility, with the upper band at $1.6164 and the lower band at $1.3576, placing the current price near the middle range.
The RSI at 38.44 indicates weakening momentum, nearing oversold territory but not yet signaling a reversal. The MACD line at 0.0339 is slightly below the signal line (0.0398), suggesting potential bearish pressure in the short term. Average True Range (ATR) at 0.0650 reflects subdued volatility.
Key resistance levels to watch are the 52-week high at $1.9382 and the YTD high at $2.4103, while immediate support lies near the 20-day MA at $1.4870 and the lower Bollinger Band at $1.3576. A break below $1.3576 could test the 50-day MA at $1.4172, whereas a move above $1.6164 may target higher resistance zones. Investors should monitor RSI and MACD for trend confirmation.
Ripple (XRP) is currently trading at $1.5064, showing minimal daily movement with a slight decline of 0.07%. The price remains above key moving averages, with the 20-day MA at $1.4870, the 50-day MA at $1.4172, and the 200-day MA at $1.2801, indicating a bullish long-term trend despite recent consolidation. Bollinger Bands suggest moderate volatility, with the upper band at $1.6164 and the lower band at $1.3576, placing the current price near the middle range.
The RSI at 38.44 indicates weakening momentum, nearing oversold territory but not yet signaling a reversal. The MACD line at 0.0339 is slightly below the signal line (0.0398), suggesting potential bearish pressure in the short term. Average True Range (ATR) at 0.0650 reflects subdued volatility.
Key resistance levels to watch are the 52-week high at $1.9382 and the YTD high at $2.4103, while immediate support lies near the 20-day MA at $1.4870 and the lower Bollinger Band at $1.3576. A break below $1.3576 could test the 50-day MA at $1.4172, whereas a move above $1.6164 may target higher resistance zones. Investors should monitor RSI and MACD for trend confirmation.
Technical Metrics
| Metric | Value |
|---|---|
| Current Price | $1.5064 |
| Daily Change | -0.07% |
| MA 20 | $1.4870 |
| % from MA20 | +1.30% |
| MA 50 | $1.4172 |
| % from MA50 | +6.30% |
| MA 200 | $1.2801 |
| % from MA200 | +17.67% |
| BB Upper | $1.6164 |
| % from BB Upper | -6.81% |
| BB Lower | $1.3576 |
| % from BB Lower | +10.96% |
| RSI (14) | 38.44 |
| MACD | 0.033863 |
| MACD Signal | 0.039827 |
| ATR (14) | 0.065007 |
| 3-Day High | $1.5285 |
| 3-Day Low | $1.4859 |
| 52-Week High | $1.9382 |
| % from 52W High | -22.28% |
| 52-Week Low | $0.9884 |
| % from 52W Low | +52.40% |
| YTD High | $2.4103 |
| % from YTD High | -37.50% |
| YTD Low | $0.9884 |
| % from YTD Low | +52.40% |
📊 Market Commentary
Ripple (XRP) is trading at $1.5064, showing minor losses of 0.07% today amid mixed market sentiment. The Relative Strength Index (RSI) at 38.4 suggests XRP is approaching oversold territory, though it remains above the critical 30 threshold, indicating potential for further downside before a reversal. Over the past 52 weeks, XRP has fluctuated between $0.9884 and $1.9382, with the current price sitting closer to the mid-range, reflecting a period of consolidation after earlier volatility.
Market sentiment around XRP remains cautious as traders monitor broader crypto trends and regulatory developments. The ongoing legal scrutiny surrounding Ripple Labs continues to weigh on investor confidence, though recent progress in the case has provided some stability. Key support levels to watch include $1.4500 and the psychological $1.4000 mark, which could act as buying zones if downward pressure persists. On the upside, resistance is seen near $1.6000, followed by $1.7500, a level that has historically triggered profit-taking.
Traders are also keeping an eye on trading volume and institutional interest, as low liquidity could exacerbate price swings. With the RSI nearing oversold conditions, some may look for signs of accumulation or a bullish divergence before entering new positions. For now, XRP appears to be in a holding pattern, with market participants awaiting clearer signals from both technical indicators and external catalysts.
Market sentiment around XRP remains cautious as traders monitor broader crypto trends and regulatory developments. The ongoing legal scrutiny surrounding Ripple Labs continues to weigh on investor confidence, though recent progress in the case has provided some stability. Key support levels to watch include $1.4500 and the psychological $1.4000 mark, which could act as buying zones if downward pressure persists. On the upside, resistance is seen near $1.6000, followed by $1.7500, a level that has historically triggered profit-taking.
Traders are also keeping an eye on trading volume and institutional interest, as low liquidity could exacerbate price swings. With the RSI nearing oversold conditions, some may look for signs of accumulation or a bullish divergence before entering new positions. For now, XRP appears to be in a holding pattern, with market participants awaiting clearer signals from both technical indicators and external catalysts.
Disclaimer
The content on MarketsFN.com is provided for educational and informational purposes only. It does not constitute financial advice or investment recommendations. All investments involve risk. Cryptocurrency markets are highly volatile. Past performance does not guarantee future results.