Dogecoin Tests Key Support at $0.095 as RSI Nears Oversold
QuoteReporter
•2 min read
Dogecoin Tests Key Support at $0.095 as RSI Nears Oversold
Dogecoin (DOGE/USD) | October 06, 2026 $0.0950 -0.48%
🔍 Technical Analysis
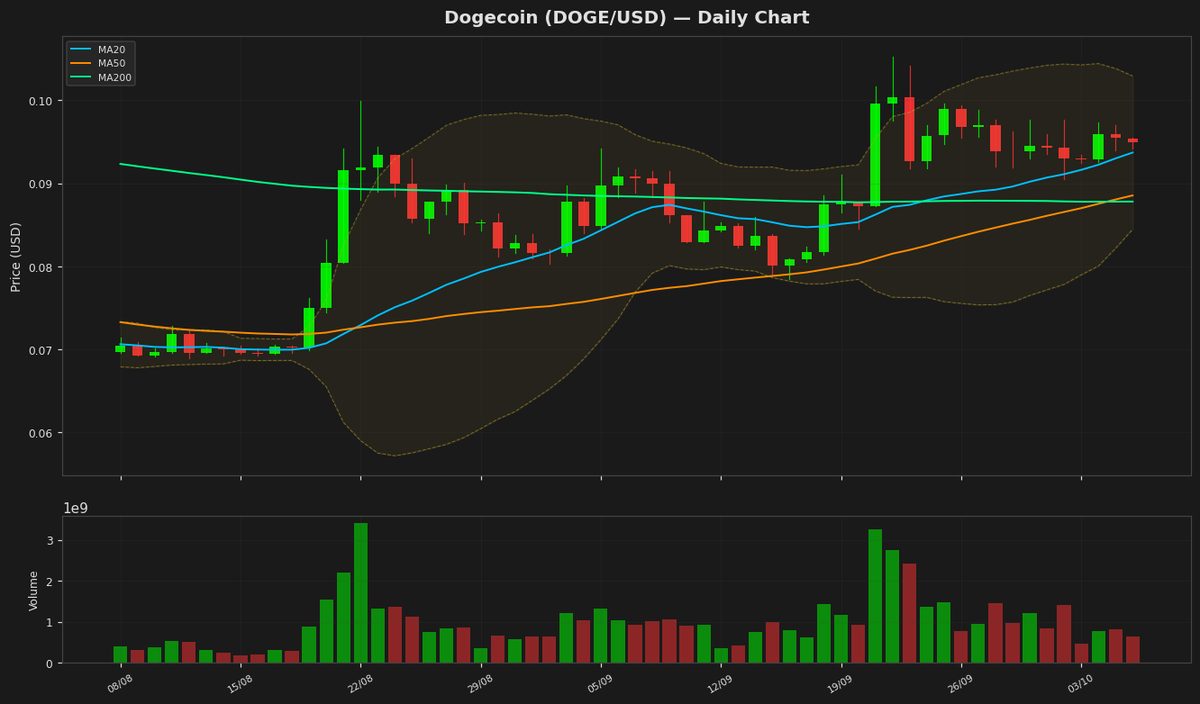
Dogecoin (DOGE) is currently trading at $0.094970, showing a minor daily decline of 0.48%. The price remains above key moving averages, with the 20-day MA at $0.093695, the 50-day MA at $0.088533, and the 200-day MA at $0.087791, suggesting a neutral to slightly bullish mid-term trend. The Bollinger Bands indicate moderate volatility, with the upper band at $0.102924 and the lower band at $0.084467. The price hovering near the middle band suggests consolidation. The RSI at 39.532179 reflects weakening momentum but has not yet entered oversold territory. The MACD line at 0.002278 is below the signal line at 0.002637, indicating potential bearish pressure in the short term. Key support levels are found near the 50-day MA at $0.088533 and the lower Bollinger Band at $0.084467, while resistance is seen at the upper Bollinger Band at $0.102924 and the year-to-date high of $0.156091. The ATR(14) of 0.00457 suggests low volatility, reinforcing the consolidation phase. Traders should monitor a breakout above $0.102924 or a drop below $0.084467 for directional bias. The 52-week range between $0.067973 and $0.12727199 provides broader context for long-term positioning.
Technical Metrics
| Metric | Value |
|---|---|
| Current Price | $0.0950 |
| Daily Change | -0.48% |
| MA 20 | $0.0937 |
| % from MA20 | +1.36% |
| MA 50 | $0.0885 |
| % from MA50 | +7.27% |
| MA 200 | $0.0878 |
| % from MA200 | +8.18% |
| BB Upper | $0.1029 |
| % from BB Upper | -7.73% |
| BB Lower | $0.0845 |
| % from BB Lower | +12.43% |
| RSI (14) | 39.53 |
| MACD | 0.002278 |
| MACD Signal | 0.002637 |
| ATR (14) | 0.004570 |
| 3-Day High | $0.0974 |
| 3-Day Low | $0.0926 |
| 52-Week High | $0.1273 |
| % from 52W High | -25.38% |
| 52-Week Low | $0.0680 |
| % from 52W Low | +39.72% |
| YTD High | $0.1561 |
| % from YTD High | -39.16% |
| YTD Low | $0.0680 |
| % from YTD Low | +39.72% |
📊 Market Commentary
Dogecoin (DOGE) is currently trading at $0.0950, down 0.48% today, as the meme coin continues to consolidate within its broader 52-week range of $0.0680 to $0.1273. The Relative Strength Index (RSI) sits at 39.5, indicating neutral to slightly oversold conditions, though not yet at levels that traditionally signal a strong reversal. Market sentiment remains cautious, with DOGE struggling to regain momentum amid mixed signals in the broader cryptocurrency market.
Key support levels to watch include the psychological $0.0900 mark, followed by the yearly low of $0.0680, which has historically acted as a strong floor. On the upside, resistance is seen near $0.1000, a level that has repeatedly capped recent rallies, with stronger resistance at the yearly high of $0.1273. Traders are monitoring Bitcoin’s price action for directional cues, as DOGE often moves in tandem with the broader market.
Despite its meme origins, Dogecoin retains a loyal following, and trading volumes remain steady, suggesting continued retail interest. However, the lack of major catalysts has kept volatility subdued. If selling pressure persists, a retest of lower support levels could materialize, while a break above $0.1000 may revive bullish sentiment. For now, traders remain cautious, awaiting clearer signals before committing to larger positions.
Key support levels to watch include the psychological $0.0900 mark, followed by the yearly low of $0.0680, which has historically acted as a strong floor. On the upside, resistance is seen near $0.1000, a level that has repeatedly capped recent rallies, with stronger resistance at the yearly high of $0.1273. Traders are monitoring Bitcoin’s price action for directional cues, as DOGE often moves in tandem with the broader market.
Despite its meme origins, Dogecoin retains a loyal following, and trading volumes remain steady, suggesting continued retail interest. However, the lack of major catalysts has kept volatility subdued. If selling pressure persists, a retest of lower support levels could materialize, while a break above $0.1000 may revive bullish sentiment. For now, traders remain cautious, awaiting clearer signals before committing to larger positions.
Disclaimer
The content on MarketsFN.com is provided for educational and informational purposes only. It does not constitute financial advice or investment recommendations. All investments involve risk. Cryptocurrency markets are highly volatile. Past performance does not guarantee future results.