Ripple Dips to $1.33 as RSI Hints Overbought Risk
QuoteReporter
•3 min read
Ripple Dips to $1.33 as RSI Hints Overbought Risk
Ripple (XRP/USD) | September 02, 2026 $1.3335 -1.34%
🔍 Technical Analysis
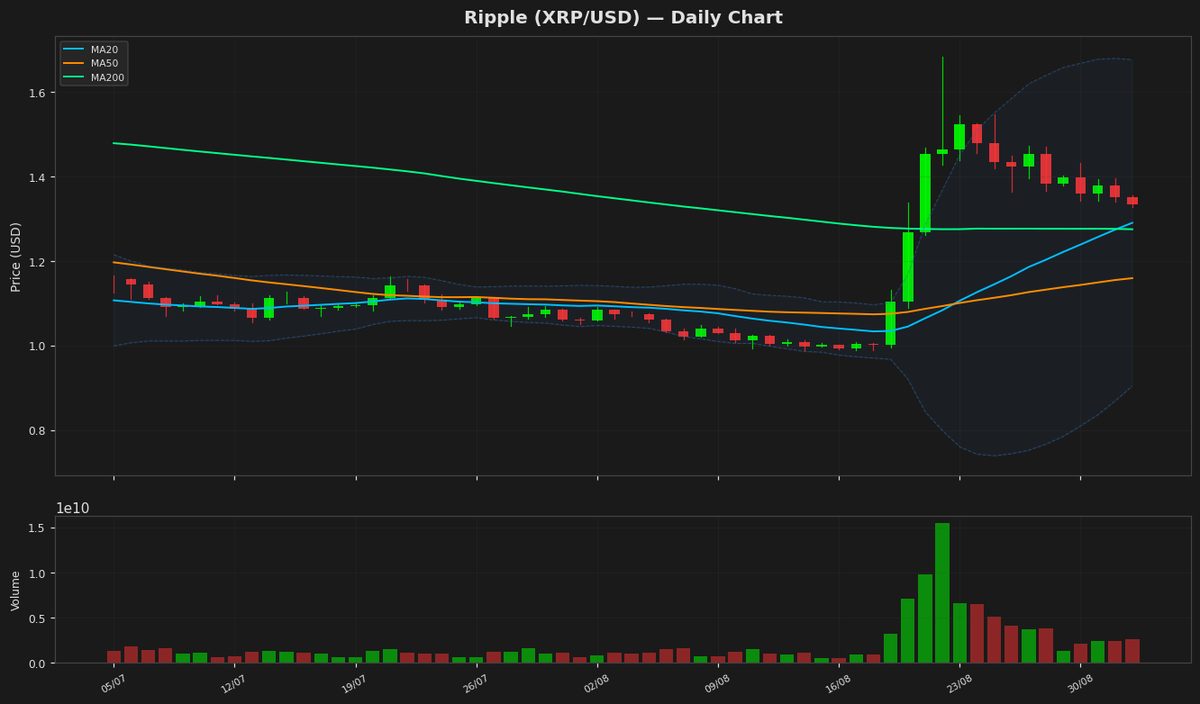
Ripple (XRP) is currently trading at $1.333500, down 1.34% on the day, showing mild bearish pressure after recent gains. The price remains above key moving averages, with the 20-day MA at $1.289965, the 50-day MA at $1.159001, and the 200-day MA at $1.274749, indicating a bullish trend in the medium to long term. The proximity of the 20-day and 200-day MAs suggests consolidation, with the 50-day MA providing strong support. Bollinger Bands reveal volatility, with the upper band at $1.676036 and the lower band at $0.903894, placing the current price in the upper half of the range. The RSI at 65.608896 is approaching overbought territory but still has room before hitting the 70 threshold, suggesting potential for further upside if momentum persists. The MACD at 0.074658 is slightly below its signal line at 0.082996, indicating a possible short-term bearish crossover. Key resistance levels to watch are the yearly high at $2.41026402 and the upper Bollinger Band, while support lies at the 20-day MA ($1.289965) and the psychological $1.20 level. ATR(14) at 0.108923 reflects moderate volatility, typical for XRP. The 52-week range ($0.98842198 to $2.41026402) highlights the asset's broad trading range, with the current price positioned mid-range. Traders should monitor the MACD for confirmation of trend direction and watch for a break above $1.40 or a fall below $1.20 for clearer signals.
Technical Metrics
| Metric | Value |
|---|---|
| Current Price | $1.3335 |
| Daily Change | -1.34% |
| MA 20 | $1.2900 |
| % from MA20 | +3.37% |
| MA 50 | $1.1590 |
| % from MA50 | +15.06% |
| MA 200 | $1.2747 |
| % from MA200 | +4.61% |
| BB Upper | $1.6760 |
| % from BB Upper | -20.44% |
| BB Lower | $0.9039 |
| % from BB Lower | +47.53% |
| RSI (14) | 65.61 |
| MACD | 0.074658 |
| MACD Signal | 0.082996 |
| ATR (14) | 0.108923 |
| 3-Day High | $1.3949 |
| 3-Day Low | $1.3282 |
| 52-Week High | $2.4103 |
| % from 52W High | -44.67% |
| 52-Week Low | $0.9884 |
| % from 52W Low | +34.91% |
| YTD High | $2.4103 |
| % from YTD High | -44.67% |
| YTD Low | $0.9884 |
| % from YTD Low | +34.91% |
📊 Market Commentary
Ripple (XRP) is currently trading at $1.3335, down 1.34% over the past 24 hours. The Relative Strength Index (RSI) sits at 65.6, indicating that XRP is approaching overbought territory but still retains some upward momentum. Over the past year, XRP has fluctuated between $0.9884 and $2.4103, reflecting significant volatility amid broader market trends and ongoing developments in Ripple’s legal battles with the SEC.
Market sentiment around XRP remains cautiously optimistic, with traders closely monitoring key resistance and support levels. The $1.40 level has emerged as near-term resistance, while $1.20 serves as a critical support zone. A break above $1.40 could signal renewed bullish interest, while a drop below $1.20 may trigger further downside pressure. Traders are also watching trading volume, which has been steady but not exceptionally high, suggesting a lack of strong directional conviction in the short term.
The broader cryptocurrency market’s performance, particularly Bitcoin and Ethereum, continues to influence XRP’s price action. Additionally, regulatory updates surrounding Ripple’s case with the SEC remain a focal point, as any significant developments could impact investor sentiment. For now, XRP appears to be consolidating within its recent range, with traders awaiting clearer signals before committing to larger positions. The RSI’s position suggests that while upside potential exists, buyers should remain mindful of potential pullbacks if momentum wanes.
Market sentiment around XRP remains cautiously optimistic, with traders closely monitoring key resistance and support levels. The $1.40 level has emerged as near-term resistance, while $1.20 serves as a critical support zone. A break above $1.40 could signal renewed bullish interest, while a drop below $1.20 may trigger further downside pressure. Traders are also watching trading volume, which has been steady but not exceptionally high, suggesting a lack of strong directional conviction in the short term.
The broader cryptocurrency market’s performance, particularly Bitcoin and Ethereum, continues to influence XRP’s price action. Additionally, regulatory updates surrounding Ripple’s case with the SEC remain a focal point, as any significant developments could impact investor sentiment. For now, XRP appears to be consolidating within its recent range, with traders awaiting clearer signals before committing to larger positions. The RSI’s position suggests that while upside potential exists, buyers should remain mindful of potential pullbacks if momentum wanes.
Disclaimer
The content on MarketsFN.com is provided for educational and informational purposes only. It does not constitute financial advice or investment recommendations. All investments involve risk. Cryptocurrency markets are highly volatile. Past performance does not guarantee future results.