Ripple Breaks $1.36 as RSI Signals Oversold Bounce
QuoteReporter
•2 min read
Ripple (XRP/USD) | October 13, 2026 $1.3643 +1.85%
🔍 Technical Analysis
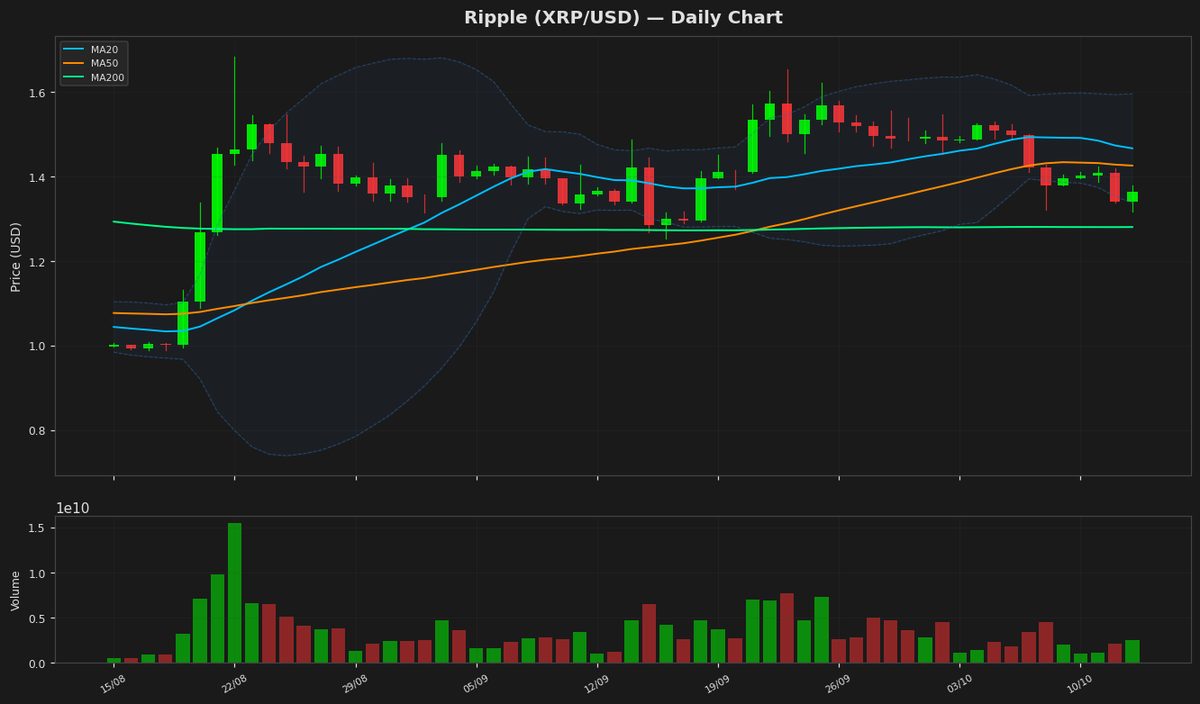
Ripple (XRP) is currently trading at $1.364300, showing a modest daily gain of 1.85%. The price remains below key moving averages, with the MA20 at $1.466176, MA50 at $1.425351, and MA200 at $1.279956, indicating a bearish short-term trend but potential long-term support near the MA200. Bollinger Bands highlight volatility, with the upper band at $1.59518 and the lower band at $1.337172, suggesting the price is hovering near the lower band, which may act as a temporary support level. The RSI(14) at 30.193826 indicates oversold conditions, which could precede a short-term rebound. The MACD histogram is negative at -0.012911, with the signal line at 0.007492, reinforcing bearish momentum but showing potential for a reversal if the MACD crosses above the signal line. Key support levels to watch are $1.337172 (lower Bollinger Band) and $1.279956 (MA200), while resistance lies at $1.425351 (MA50) and $1.466176 (MA20). The 52-week high of $1.68375397 and YTD high of $2.41026402 remain distant targets, but a break above $1.466176 could signal renewed bullish momentum. The ATR(14) at 0.051241 suggests moderate volatility, warranting cautious monitoring of price action near critical levels.
Technical Metrics
| Metric | Value |
|---|---|
| Current Price | $1.3643 |
| Daily Change | +1.85% |
| MA 20 | $1.4662 |
| % from MA20 | -6.95% |
| MA 50 | $1.4254 |
| % from MA50 | -4.28% |
| MA 200 | $1.2800 |
| % from MA200 | +6.59% |
| BB Upper | $1.5952 |
| % from BB Upper | -14.47% |
| BB Lower | $1.3372 |
| % from BB Lower | +2.03% |
| RSI (14) | 30.19 |
| MACD | -0.012911 |
| MACD Signal | 0.007492 |
| ATR (14) | 0.051241 |
| 3-Day High | $1.4231 |
| 3-Day Low | $1.3174 |
| 52-Week High | $1.6838 |
| % from 52W High | -18.97% |
| 52-Week Low | $0.9884 |
| % from 52W Low | +38.03% |
| YTD High | $2.4103 |
| % from YTD High | -43.40% |
| YTD Low | $0.9884 |
| % from YTD Low | +38.03% |
📊 Market Commentary
Ripple (XRP) is currently trading at $1.3643, up 1.85% today, as the broader crypto market shows cautious optimism. The Relative Strength Index (RSI) at 30.2 suggests XRP is approaching oversold territory, which could indicate potential for a short-term rebound if buying interest returns. However, market sentiment remains mixed due to lingering regulatory uncertainties surrounding Ripple’s ongoing legal battles with the SEC.
Key price levels to watch include the 52-week low of $0.9884, which serves as a critical support zone, and the yearly high of $1.6838, acting as a major resistance level. Traders are closely monitoring whether XRP can hold above the psychological $1.30-$1.35 range, which has been a pivot point in recent weeks. A sustained move above $1.40 could signal renewed bullish momentum, while failure to hold current levels may lead to a retest of lower support near $1.20.
Volume trends and regulatory developments remain focal points for traders, as any clarity in Ripple’s legal case could significantly impact price action. For now, XRP appears to be consolidating within its broader range, with technical indicators suggesting a possible inflection point given the low RSI reading. Market participants are likely to remain cautious until clearer signals emerge.
Key price levels to watch include the 52-week low of $0.9884, which serves as a critical support zone, and the yearly high of $1.6838, acting as a major resistance level. Traders are closely monitoring whether XRP can hold above the psychological $1.30-$1.35 range, which has been a pivot point in recent weeks. A sustained move above $1.40 could signal renewed bullish momentum, while failure to hold current levels may lead to a retest of lower support near $1.20.
Volume trends and regulatory developments remain focal points for traders, as any clarity in Ripple’s legal case could significantly impact price action. For now, XRP appears to be consolidating within its broader range, with technical indicators suggesting a possible inflection point given the low RSI reading. Market participants are likely to remain cautious until clearer signals emerge.
Disclaimer
The content on MarketsFN.com is provided for educational and informational purposes only. It does not constitute financial advice or investment recommendations. All investments involve risk. Cryptocurrency markets are highly volatile. Past performance does not guarantee future results.