Tron Eyes Rebound as RSI Hits Oversold at $0.3295
QuoteReporter
•3 min read
Tron (TRX/USD) | October 13, 2026 $0.3295 +0.22%
🔍 Technical Analysis
**Technical Analysis of Tron (TRX)**
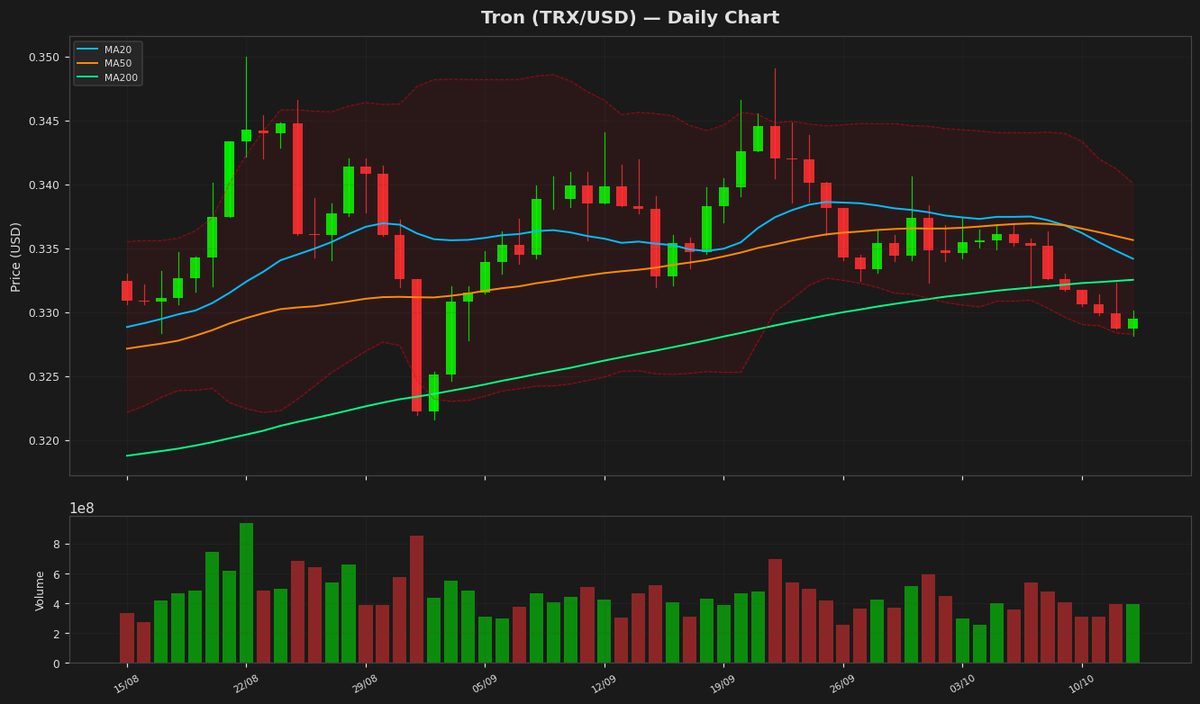
Tron (TRX) is currently trading at $0.329453, showing marginal daily gains of 0.22%. The price remains below key moving averages, with the 20-day MA at $0.334166 and the 50-day MA at $0.33563, indicating short-term bearish pressure. The 200-day MA at $0.33252 is acting as a dynamic resistance, reinforcing the downtrend. Bollinger Bands show a narrowing range, with the upper band at $0.340079 and the lower band at $0.328254, suggesting reduced volatility and potential consolidation. The price hovering near the lower band hints at oversold conditions.
The RSI(14) at 33.819494 is nearing oversold territory but has not yet signaled a reversal. The MACD histogram is negative at -0.001852, with the signal line at -0.001109, indicating bearish momentum persists. ATR(14) at $0.002926 reflects low volatility, aligning with the consolidation phase.
Key resistance levels to watch are the 20-day and 50-day MAs around $0.334-0.336, followed by the yearly high of $0.376332. Immediate support lies near the Bollinger lower band at $0.328254, with stronger support at the 52-week low of $0.26813799. A decisive break below this level could trigger further downside, while reclaiming the 200-day MA may signal a bullish reversal. Traders should monitor RSI for potential divergence and MACD for a bullish crossover to confirm trend shifts.
Tron (TRX) is currently trading at $0.329453, showing marginal daily gains of 0.22%. The price remains below key moving averages, with the 20-day MA at $0.334166 and the 50-day MA at $0.33563, indicating short-term bearish pressure. The 200-day MA at $0.33252 is acting as a dynamic resistance, reinforcing the downtrend. Bollinger Bands show a narrowing range, with the upper band at $0.340079 and the lower band at $0.328254, suggesting reduced volatility and potential consolidation. The price hovering near the lower band hints at oversold conditions.
The RSI(14) at 33.819494 is nearing oversold territory but has not yet signaled a reversal. The MACD histogram is negative at -0.001852, with the signal line at -0.001109, indicating bearish momentum persists. ATR(14) at $0.002926 reflects low volatility, aligning with the consolidation phase.
Key resistance levels to watch are the 20-day and 50-day MAs around $0.334-0.336, followed by the yearly high of $0.376332. Immediate support lies near the Bollinger lower band at $0.328254, with stronger support at the 52-week low of $0.26813799. A decisive break below this level could trigger further downside, while reclaiming the 200-day MA may signal a bullish reversal. Traders should monitor RSI for potential divergence and MACD for a bullish crossover to confirm trend shifts.
Technical Metrics
| Metric | Value |
|---|---|
| Current Price | $0.3295 |
| Daily Change | +0.22% |
| MA 20 | $0.3342 |
| % from MA20 | -1.41% |
| MA 50 | $0.3356 |
| % from MA50 | -1.84% |
| MA 200 | $0.3325 |
| % from MA200 | -0.92% |
| BB Upper | $0.3401 |
| % from BB Upper | -3.12% |
| BB Lower | $0.3283 |
| % from BB Lower | +0.37% |
| RSI (14) | 33.82 |
| MACD | -0.001852 |
| MACD Signal | -0.001109 |
| ATR (14) | 0.002926 |
| 3-Day High | $0.3323 |
| 3-Day Low | $0.3282 |
| 52-Week High | $0.3763 |
| % from 52W High | -12.46% |
| 52-Week Low | $0.2681 |
| % from 52W Low | +22.87% |
| YTD High | $0.3763 |
| % from YTD High | -12.46% |
| YTD Low | $0.2681 |
| % from YTD Low | +22.87% |
📊 Market Commentary
Tron (TRX) is trading at $0.3295, showing a modest gain of 0.22% today amid mixed market conditions. The Relative Strength Index (RSI) at 33.8 suggests TRX is nearing oversold territory, which could indicate potential for a short-term rebound if buying interest returns. However, the broader sentiment remains cautious as TRX continues to trade within its 52-week range of $0.2681 to $0.3763, reflecting a period of consolidation without strong directional momentum.
Key support levels to watch include the yearly low of $0.2681, which has held firm during recent pullbacks, while resistance is seen near the upper bound of $0.3763. A break above this level could signal renewed bullish interest, though traders remain wary given the lack of significant volume spikes. The current RSI reading suggests weakening downside pressure, but confirmation from market participation is needed for a sustained move.
Traders are closely monitoring Bitcoin's price action, as broader crypto market trends often influence TRX’s performance. Additionally, developments within the Tron ecosystem, including network activity and adoption metrics, could impact sentiment. For now, TRX appears range-bound, with short-term traders looking for opportunities around key support and resistance levels while long-term holders assess broader market conditions before committing to larger positions. Volatility remains subdued, but any shift in macroeconomic factors or crypto-specific news could alter the current equilibrium.
Key support levels to watch include the yearly low of $0.2681, which has held firm during recent pullbacks, while resistance is seen near the upper bound of $0.3763. A break above this level could signal renewed bullish interest, though traders remain wary given the lack of significant volume spikes. The current RSI reading suggests weakening downside pressure, but confirmation from market participation is needed for a sustained move.
Traders are closely monitoring Bitcoin's price action, as broader crypto market trends often influence TRX’s performance. Additionally, developments within the Tron ecosystem, including network activity and adoption metrics, could impact sentiment. For now, TRX appears range-bound, with short-term traders looking for opportunities around key support and resistance levels while long-term holders assess broader market conditions before committing to larger positions. Volatility remains subdued, but any shift in macroeconomic factors or crypto-specific news could alter the current equilibrium.
Disclaimer
The content on MarketsFN.com is provided for educational and informational purposes only. It does not constitute financial advice or investment recommendations. All investments involve risk. Cryptocurrency markets are highly volatile. Past performance does not guarantee future results.