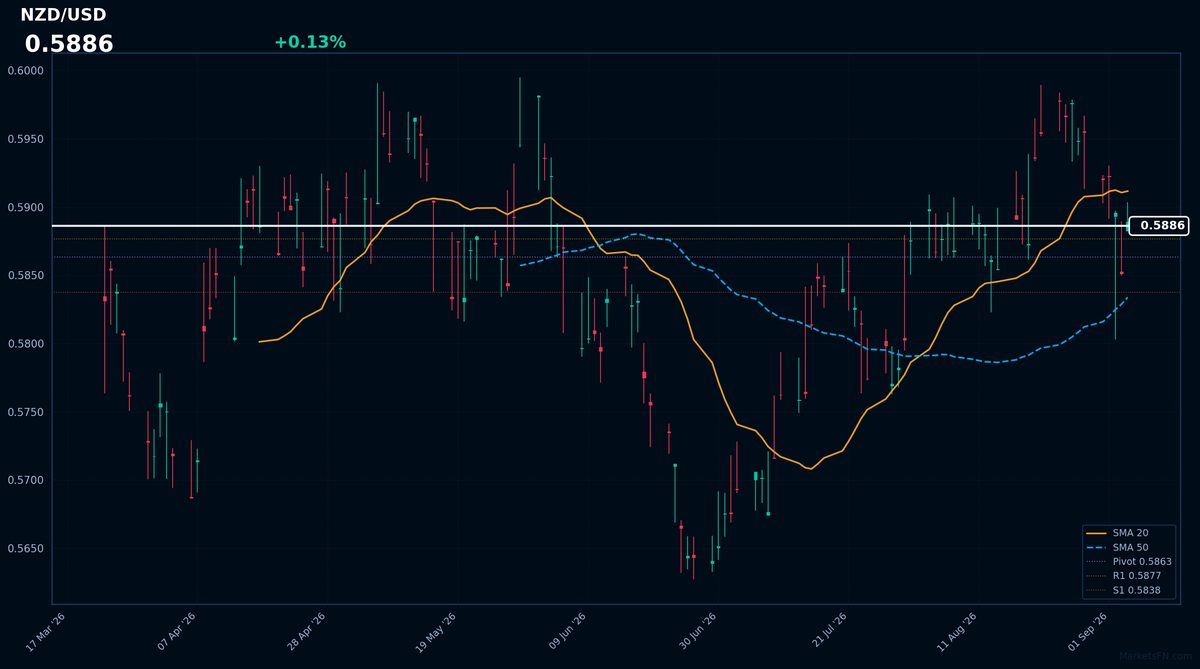
NZD/USD: Up 0.13% to 0.5886 — Price Below SMA-20
MarketsFN Team
NZD/USD: Up 0.13% to 0.5886 — Price Below SMA-20
Published: September 04, 2026 · MarketsFN Team
| Pair | Rate | Change | RSI(14) | SMA-20 | SMA-50 | 52W High | 52W Low | Pivot | R1 | S1 |
|---|---|---|---|---|---|---|---|---|---|---|
| NZD/USD | 0.5886 | +0.13% | 49.8 | 0.5912 | 0.5834 | 0.5982 | 0.5641 | 0.5863 | 0.5877 | 0.5838 |
NZD/USD is trading at 0.5886 (+0.13%) as of September 04, 2026, during the European session, with the pair having opened near the previous close of 0.5879. The current rate is within the day's range of 0.5882 to 0.5903, indicating a relatively contained daily move. Over the past 52 weeks, NZD/USD has traded between 0.5641 and 0.5982, with the current level near the middle of this range. The pair is below the 20-day simple moving average (SMA-20) of 0.5912 but above the 50-day simple moving average (SMA-50) of 0.5834, suggesting a potential consolidation phase.
The Relative Strength Index (RSI) stands at 49.8, indicating neutral territory and no clear directional bias from a momentum perspective. The Average True Range (ATR) over 14 days is 0.0054, reflecting the current daily volatility. Key technical levels to watch include the pivot at 0.5863, with resistance at R1: 0.5877 already breached, and support at S1: 0.5838. The market may be underpricing the potential for a breakout from this consolidation phase. A move above the SMA-20 at 0.5912 could signal a resumption of the broader uptrend, while a drop below S1: 0.5838 may indicate further downside. The next catalyst for NZD/USD will be a break above or below these key levels, with a decisive move potentially triggered by a significant economic data release or a shift in monetary policy expectations.
Disclaimer
The content on MarketsFN.com is provided for educational and informational purposes only. It does not constitute financial advice or investment recommendations. All investments involve risks and past performance does not guarantee future results. You are solely responsible for your investment decisions.