NZD/USD: Down 0.66% to 0.5776 — Ascending Channel
MarketsFN Team
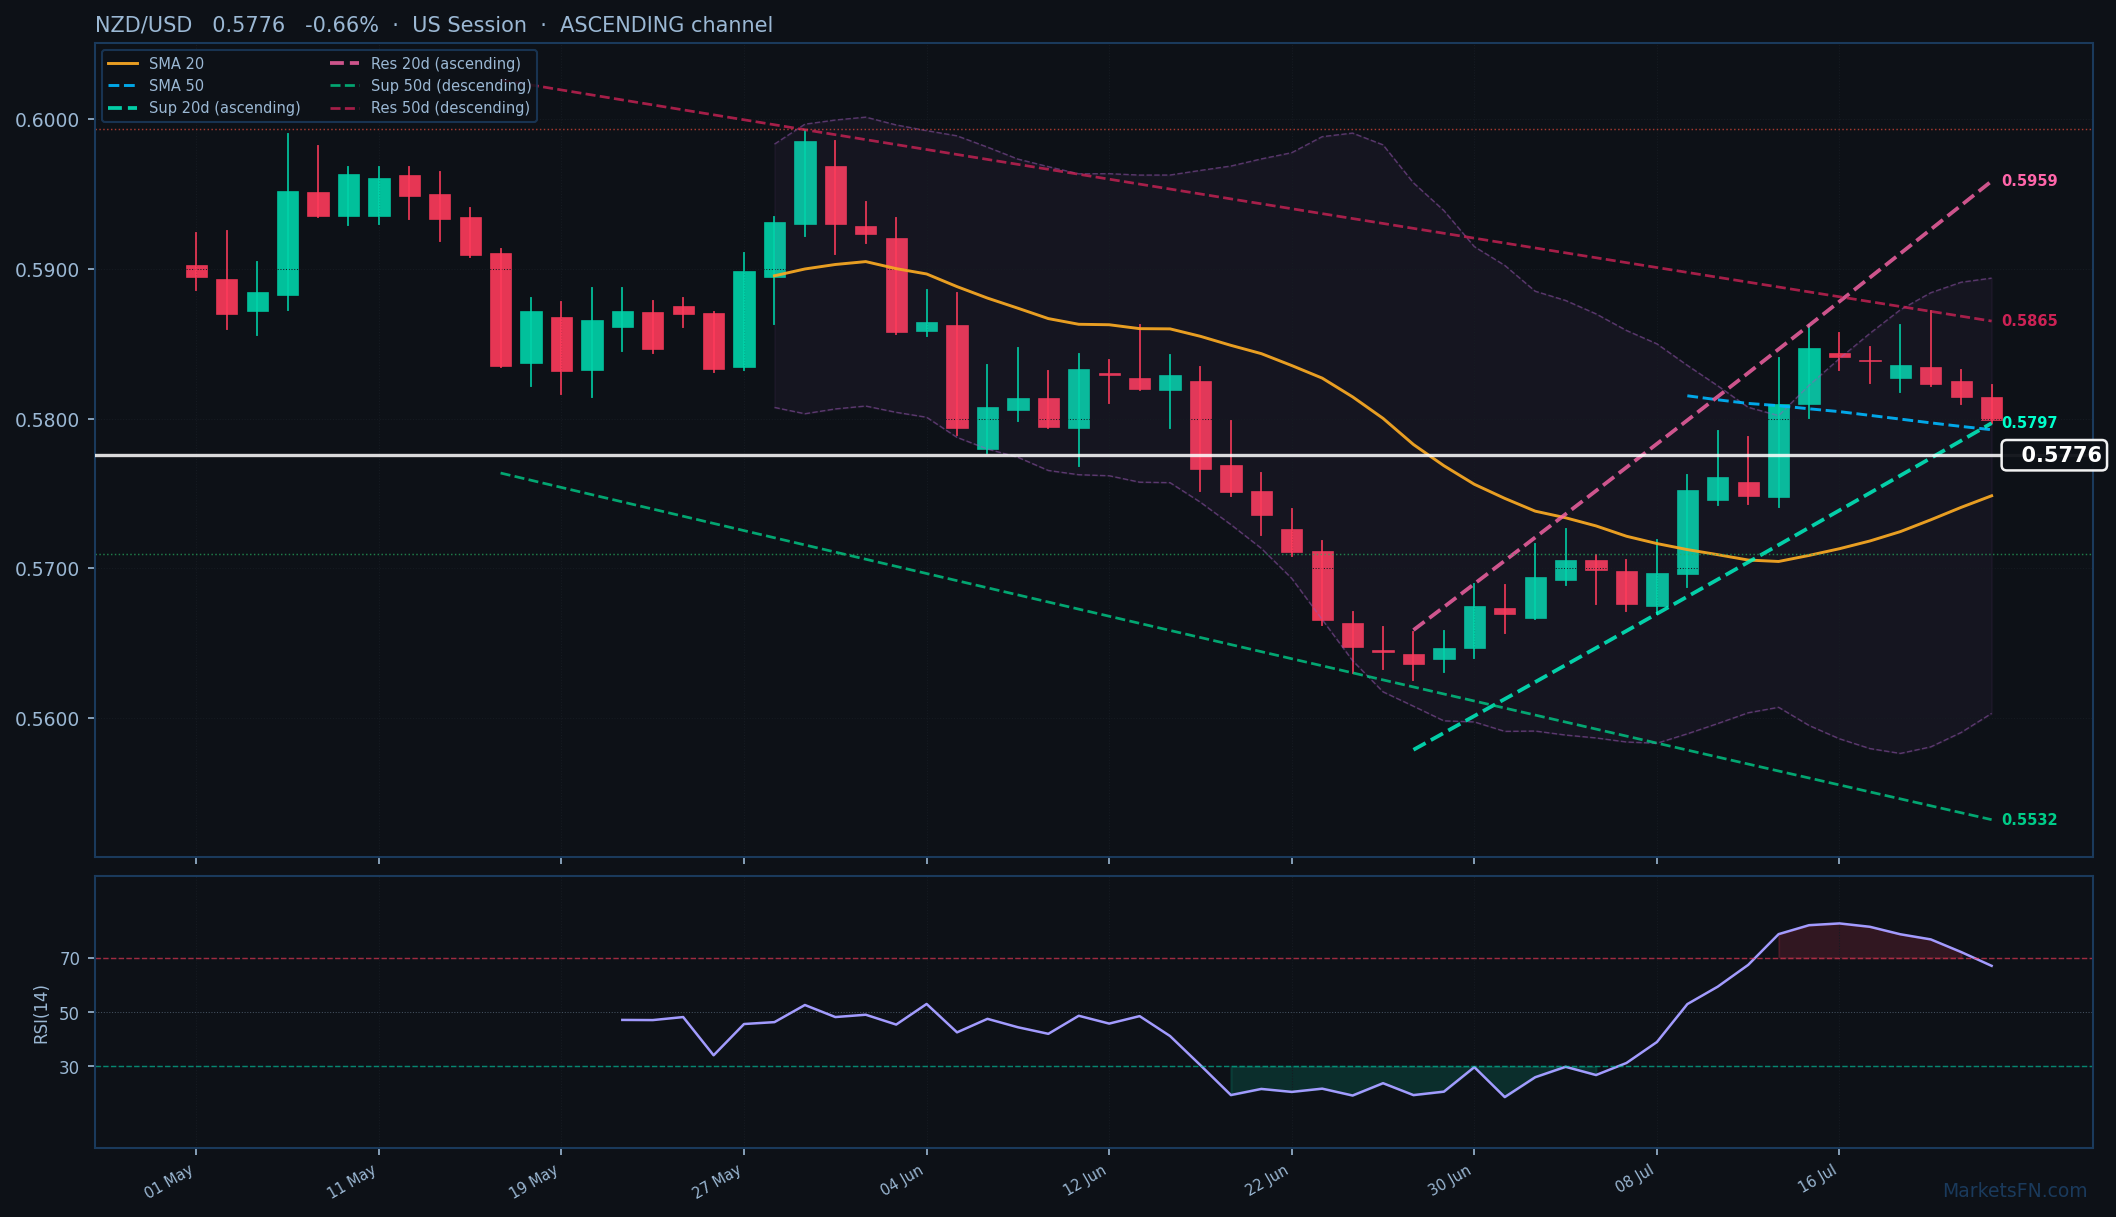
NZD/USD: Down 0.66% to 0.5776 — Ascending Channel
Published: July 23, 2026 · MarketsFN Team · US Session
| Pair | Rate | Change | RSI(14) | SMA-20 | SMA-50 | 52W High | 52W Low | Pivot | R1 | S1 |
|---|---|---|---|---|---|---|---|---|---|---|
| NZD/USD | 0.5776 | -0.66% | 67.0 | 0.5748 | 0.5793 | 0.6075 | 0.5581 | 0.5819 | 0.5828 | 0.5805 |
📊 Support & Resistance Levels
Dynamic Trendlines
| Level | Type | Direction | Distance |
|---|---|---|---|
| 0.5797 | 20d Support | ↗ ascending | +0.37% / 21.5 pips |
| 0.5959 | 20d Resistance | ↗ ascending | +3.17% / 183.3 pips |
| 0.5532 | 50d Support | ↘ descending | -4.22% / 243.7 pips |
| 0.5865 | 50d Resistance | ↘ descending | +1.55% / 89.7 pips |
Static Levels
| Level | Type | Touches | Distance |
|---|---|---|---|
| 0.5994 | Resistance | 2× | +3.36% / 194.8 pips |
| 0.5710 | Support | 2× | -1.54% / 89.5 pips |
NZD/USD is trading at 0.5776 (-0.66%), caught in a consolidation phase between its 20-day SMA (0.5748, support) and 50-day SMA (0.5793, resistance), with today’s drop breaching the latter. The pair is trapped between conflicting dynamic channels: the 20-day ascending channel (support at 0.5797, just 21.5 pips below current) suggests near-term bullish bias, while the 50-day descending channel (resistance at 0.5865, 89.7 pips above) reflects broader bearish pressure. This technical tug-of-war explains the sideways action — neither trend has decisively broken.
Static levels reinforce the range-bound narrative, with S1 at 0.5710 (89.5 pips below) and R1 at 0.5994 (194.8 pips above) acting as distant but meaningful barriers. The RSI at 67.0 is neutral but flirting with overbought territory, suggesting limited upside momentum unless fundamentals intervene.
Short-term, watch the 20-day dynamic support at 0.5797 — a break below could trigger a test of the 20-day SMA at 0.5748. Conversely, reclaiming the 50-day SMA (0.5793) and challenging the 50-day dynamic resistance at 0.5865 would signal bullish conviction. The catalyst? Friday’s US PCE data — a soft print could weaken the USD and propel NZD/USD toward the 50-day resistance, while hot inflation may reinforce the descending channel’s dominance. Until then, expect choppy trade between 0.5748-0.5793.
Disclaimer
The content on MarketsFN.com is provided for educational and informational purposes only and does not constitute financial advice. All investments involve risk and past performance does not guarantee future results.


