Natural Gas: Up 0.0% to $2.91 — Bearish — Below MA50 & MA200
QuoteReporter
•2 min read
Natural Gas: Up 0.0% to $2.91 — Bearish — Below MA50 & MA200
Analysis Date: August 28, 2026
📊 Current Market Data
CURRENT PRICE
$2.91
DAILY CHANGE
+0.03%
WEEKLY CHANGE
+4.87%
52W HIGH
$7.83
52W LOW
$2.48
💡 Key Market Factors
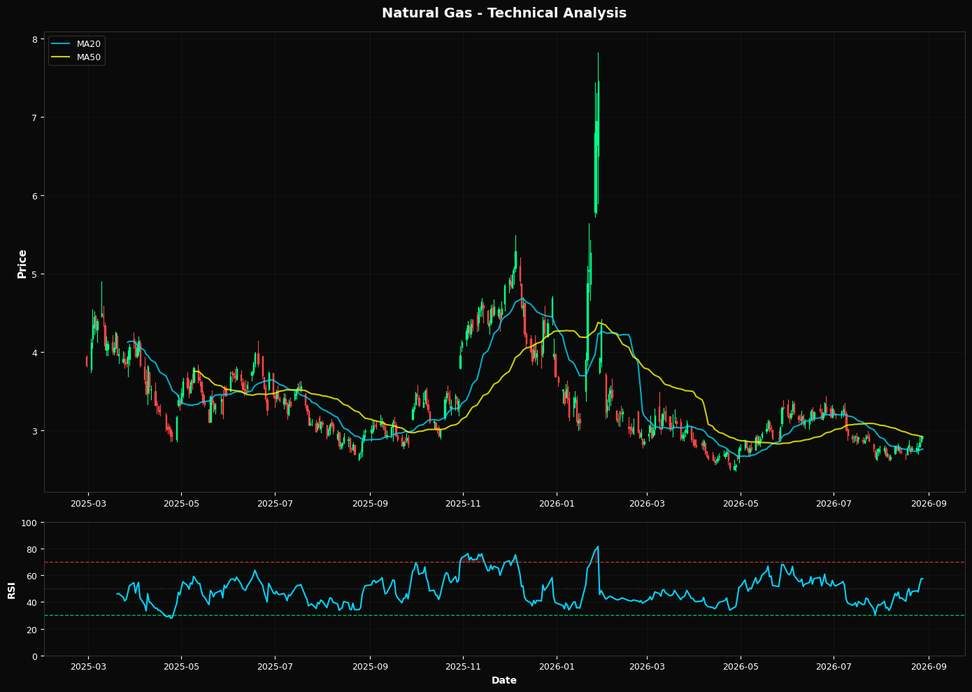
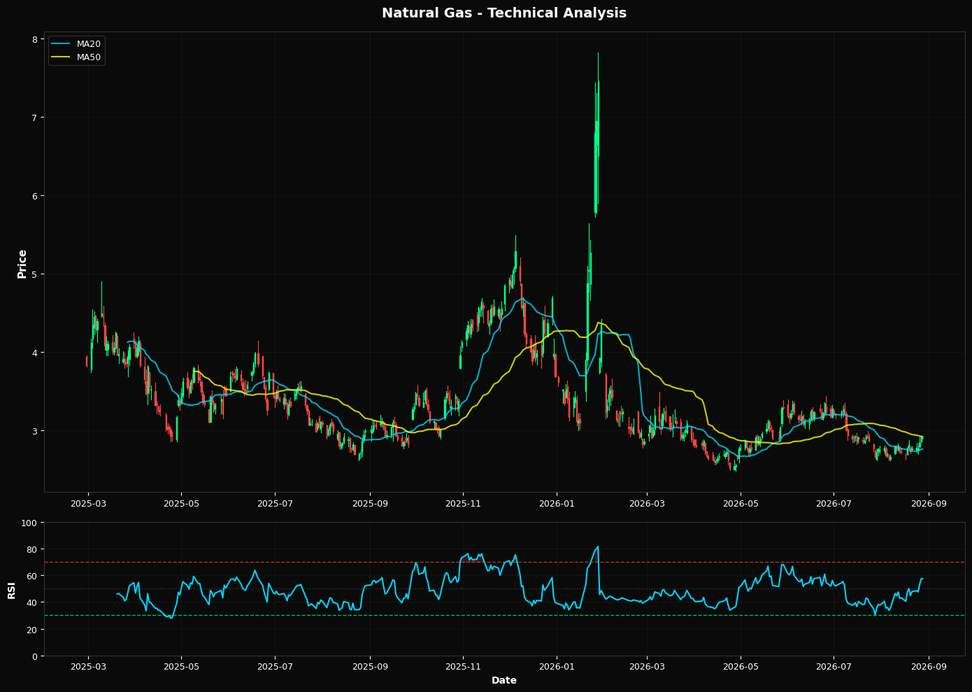
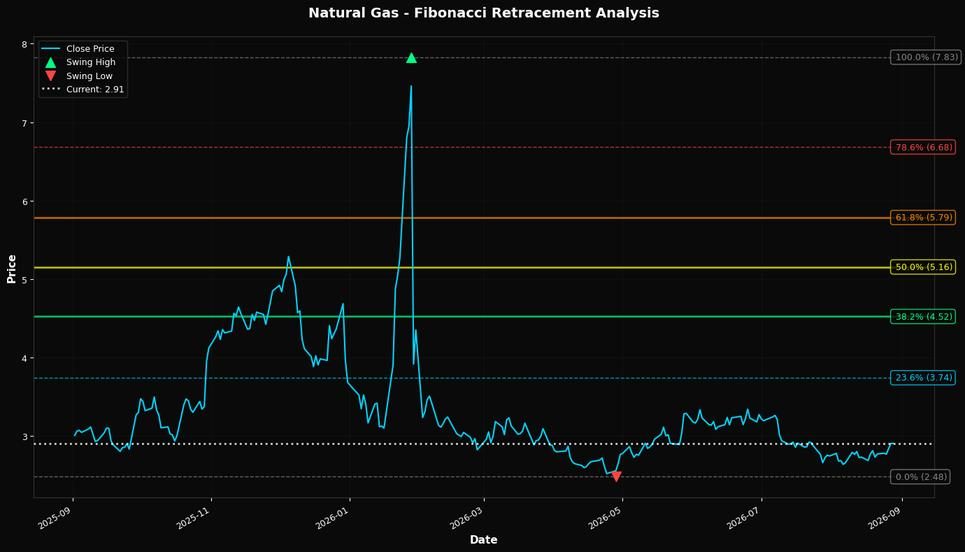
Natural gas prices are poised for a potential breakout, driven by a confluence of technical indicators and macroeconomic factors. The most pressing macro driver for natural gas today is the Federal Reserve's interest rate policy. With inflationary pressures still a concern, the Fed's stance on interest rates directly impacts the U.S. dollar's strength. A stronger dollar typically weighs on commodity prices, including natural gas, by making them more expensive for holders of other currencies. However, the current price of natural gas at $2.91, with a weekly gain of +4.87%, suggests that the market is pricing in some resilience against dollar strength, possibly due to expectations of a more dovish Fed or a stabilization in inflation rates. From a technical perspective, natural gas is at a critical juncture. The Relative Strength Index (RSI) of 57.4 indicates that the commodity is neither overbought nor oversold, suggesting room for upward movement. The price is slightly below the 50-day moving average (MA50) of $2.92, but comfortably above the 20-day moving average (MA20) of $2.76, indicating short-term bullish momentum. However, the significant gap between the current price and the 200-day moving average (MA200) of $3.35 highlights a longer-term bearish trend. The nearest Fibonacci resistance at $4.52 is a distant target, but breaking above the MA50 could set the stage for a test of higher resistance levels. The technical setup suggests a cautious bullish bias, contingent on breaking above the MA50. A key risk that could alter the current outlook is an unexpected shift in weather patterns. Natural gas demand is highly sensitive to temperature changes, particularly as we approach the winter season. A colder-than-expected winter could significantly boost demand for heating, driving prices higher. Conversely, a milder winter could suppress demand and weigh on prices. The market may be underpricing the potential for extreme weather events, which could lead to sudden price spikes. Looking ahead, the upcoming U.S. Energy Information Administration (EIA) natural gas storage report will be crucial. A larger-than-expected drawdown in inventories could confirm the bullish momentum and support a move above the MA50, while a build-up could invalidate this view and pressure prices lower. This report will provide critical insights into supply-demand dynamics and help validate or challenge the current technical and macroeconomic narratives.📈 Technical Indicators Summary
RSI (14)
57.4
50-Day MA
$2.92
200-Day MA
$3.35
Fib Level
38.2%
📊 Technical Analysis Chart (18-Month View)
📐 Fibonacci Retracement Analysis
🎯 Key Trading Levels
Key Fibonacci Levels:
- 38.2%: $4.52
- 50.0%: $5.16
- 61.8%: $5.79
Support: $2.48 (Swing Low), $2.92 (50-Day MA)
Resistance: $7.83 (Swing High)
Disclaimer
The content on MarketsFN.com is provided for educational and informational purposes only. It does not constitute financial advice, investment recommendations, or trading guidance. All investments involve risks, and past performance does not guarantee future results. You are solely responsible for your investment decisions and should conduct independent research and consult a qualified financial advisor before acting. MarketsFN.com and its authors are not liable for any losses or damages arising from your use of this information.