Natural Gas: Down 0.8% to $2.87 — Bearish — Below MA50 & MA200
QuoteReporter
•2 min read
Natural Gas: Down 0.8% to $2.87 — Bearish — Below MA50 & MA200
Analysis Date: August 31, 2026
📊 Current Market Data
CURRENT PRICE
$2.87
DAILY CHANGE
-0.80%
WEEKLY CHANGE
+2.98%
52W HIGH
$7.83
52W LOW
$2.48
💡 Key Market Factors
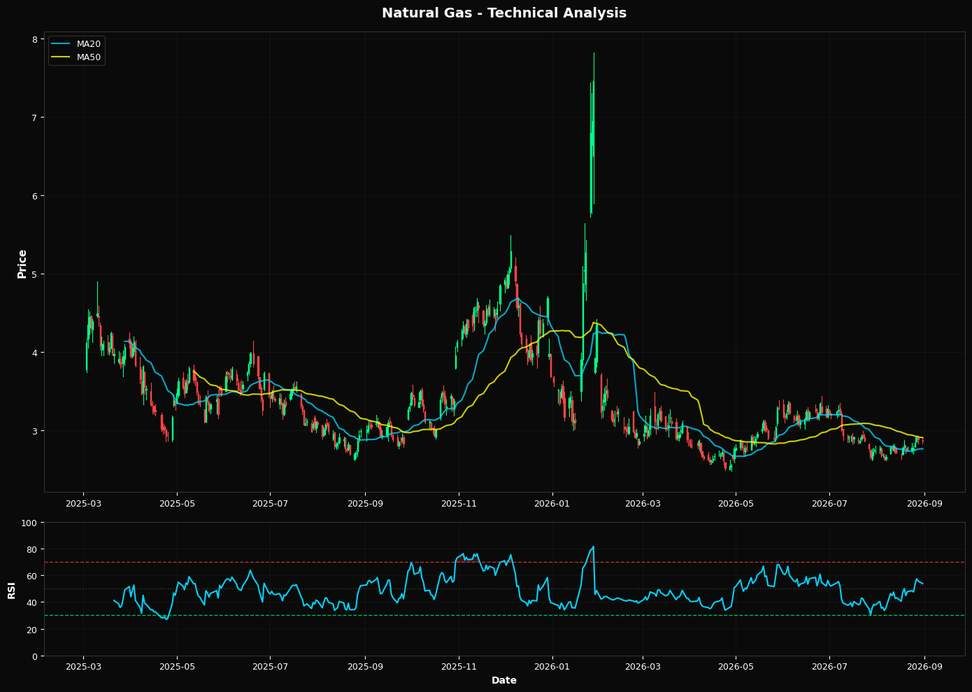
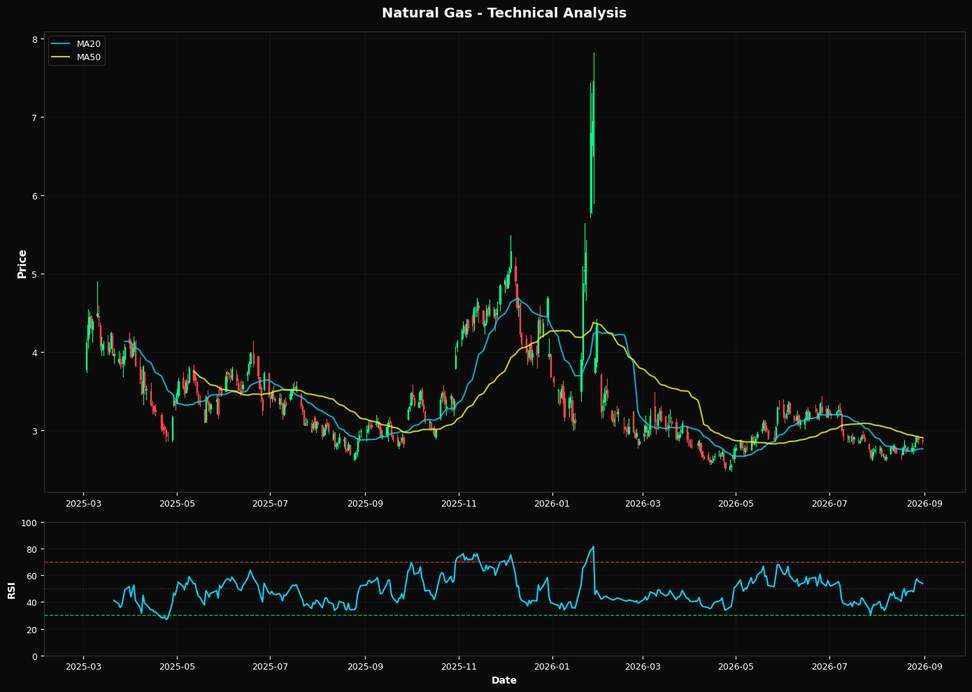
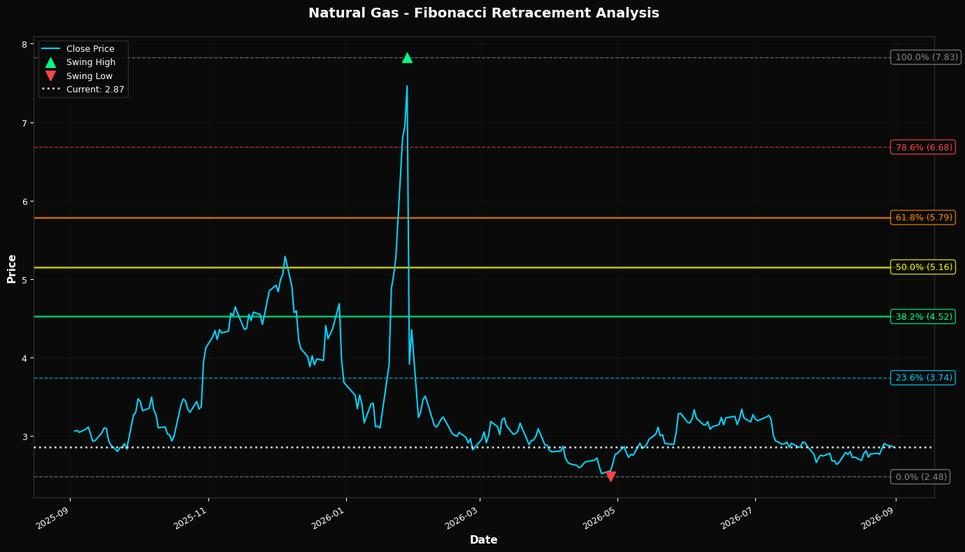
Natural Gas Faces Technical Resistance Amidst Dollar Dynamics The most pressing macro driver for natural gas today is the strength of the U.S. dollar. As the Federal Reserve maintains its hawkish stance on interest rates, the dollar remains robust, exerting downward pressure on dollar-denominated commodities like natural gas. Despite a weekly gain of +2.98%, the daily decline of -0.80% suggests that the market is sensitive to currency fluctuations. A strong dollar makes U.S. exports more expensive and less competitive globally, potentially dampening demand for natural gas. This dynamic is crucial as it could offset any supply-side constraints or demand increases, keeping prices subdued. From a technical perspective, natural gas is at a critical juncture. The current price of $2.87 sits below the 50-day moving average (MA50) of $2.91 and significantly below the 200-day moving average (MA200) of $3.34, indicating a bearish trend in the medium to long term. However, the price is above the 20-day moving average (MA20) of $2.77, suggesting some short-term bullish momentum. The Relative Strength Index (RSI) at 53.7 is neutral, indicating neither overbought nor oversold conditions. The nearest Fibonacci resistance at $4.52 is far above the current price, suggesting that any upward movement faces significant hurdles. The technical setup implies a cautious outlook, with potential for short-term gains but limited upside without a fundamental shift. A key risk that could alter the current landscape is a sudden change in weather patterns, particularly an early onset of winter in major consuming regions. A colder-than-expected winter could spike heating demand, driving prices higher and potentially breaking through technical resistance levels. This scenario could catch the market off guard, especially if traders have been underpricing the impact of weather on demand. Looking ahead, the upcoming U.S. inflation data release will be pivotal. If inflation remains stubbornly high, it could reinforce the Fed's hawkish stance, further strengthening the dollar and applying additional pressure on natural gas prices. Conversely, a softer inflation reading could weaken the dollar, providing some relief to natural gas prices and potentially validating a short-term bullish bias. This data point will be crucial in confirming or invalidating the current technical and macroeconomic outlook for natural gas.📈 Technical Indicators Summary
RSI (14)
53.7
50-Day MA
$2.91
200-Day MA
$3.34
Fib Level
38.2%
📊 Technical Analysis Chart (18-Month View)
📐 Fibonacci Retracement Analysis
🎯 Key Trading Levels
Key Fibonacci Levels:
- 38.2%: $4.52
- 50.0%: $5.16
- 61.8%: $5.79
Support: $2.48 (Swing Low), $2.91 (50-Day MA)
Resistance: $7.83 (Swing High)
Disclaimer
The content on MarketsFN.com is provided for educational and informational purposes only. It does not constitute financial advice, investment recommendations, or trading guidance. All investments involve risks, and past performance does not guarantee future results. You are solely responsible for your investment decisions and should conduct independent research and consult a qualified financial advisor before acting. MarketsFN.com and its authors are not liable for any losses or damages arising from your use of this information.