Asian Session Crude Oil Report — 15 Oct 2026
QuoteReporter
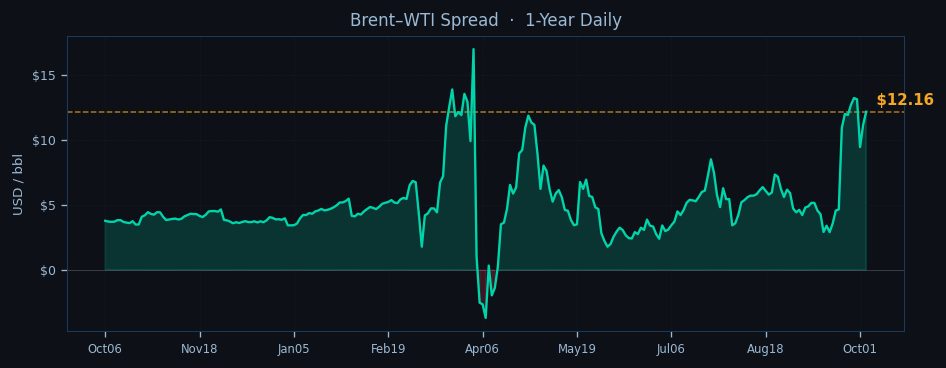
WTI crude is trading at $90.86 in early Asian hours, holding near overnight lows as the contract extends its seven-day decline to 3.96%, while Brent finds firmer footing at $103.02 despite broader bearish momentum. The Brent-WTI spread builds to $12.16 as Atlantic Basin tightness counters weaker US pricing signals. Both benchmarks test critical technical thresholds—WTI’s RSI plunges to 22.5, deep in oversold territory, while Brent’s 38.9 reading suggests milder bearish exhaustion. The front-month WTI contract now trades 1.6% below its nine-day EMA at $92.34, with Brent hovering just under its equivalent at $103.07 in a knife-edge equilibrium.
Technical pivots frame immediate battle lines, with WTI’s $89.46 daily pivot point acting as magnet after the contract fails to sustain above $90 psychological support. Brent faces more constructive positioning, its $96.17 pivot base intact as the market absorbs yesterday’s 0.75% advance. The backwardation structure steepens across both curves—WTI’s Oct26-Jul27 spread widens to -10.8% while Brent’s equivalent gap stretches to -14.6%—reinforcing near-term supply anxieties despite price softness. CME open interest data shows fresh short positioning in WTI as momentum traders press the downside, while Brent options skew tilts toward puts as hedgers brace for Middle East volatility.

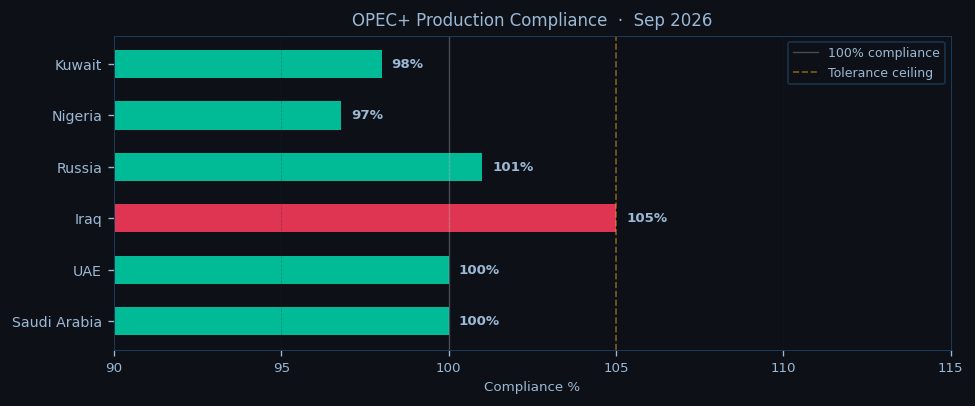
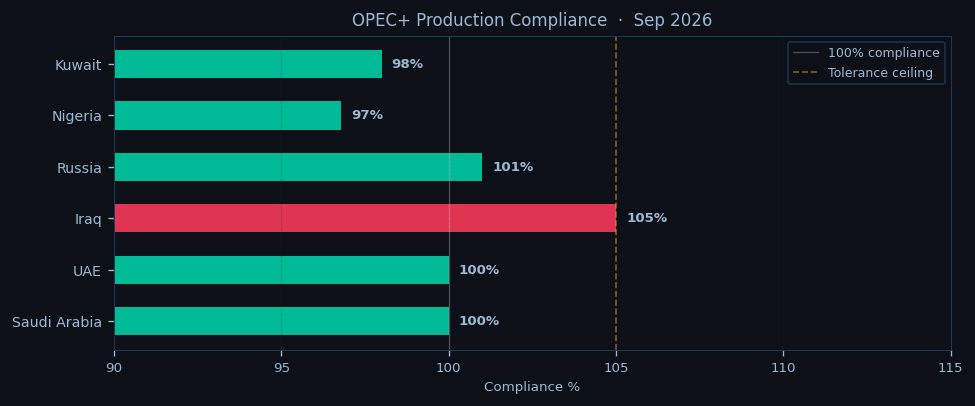
Geopolitical friction offsets inventory headwinds, with Hormuz chokepoint tensions remaining elevated after another IRGC tanker intercept overnight. Approximately 20% of global seaborne volumes face disruption risk as Tehran escalates pressure tactics ahead of nuclear negotiations. The Bab-el-Mandeb threat matrix stays active with Houthi forces continuing Red Sea harassment, forcing VLCCs toward the Cape of Good Hope and adding seven days to voyage times. These supply risks counter bearish EIA data showing a 0.9 million barrel US commercial stock build and stable 13.95 mb/d domestic production. OPEC+ discipline shows cracks as Iraq and Russia exceed quotas, though the cartel maintains a 0.6 mb/d market deficit versus call on its crude.
Asian demand signals flash amber, with Chinese teapot refinery margins compressing further as independent processors balk at current Brent levels. Regional time spreads soften as traders price in slower Q4 inventory draws, though Japanese buying emerges below $90 WTI for strategic reserve replenishment. The physical market shows divergence—Middle East sour grades command premiums amid shipping risks while Atlantic Basin sweet crude floats at discounts as floating storage builds.
European traders should monitor whether WTI defends its $89.46 pivot at the London open, with a breach risking acceleration toward $72.17 support. Brent’s ability to hold above $101.80 front-month settlement remains critical for maintaining backwardation structure. The Hormuz security situation warrants real-time tracking—any escalation could trigger rapid Brent upside toward $117.04 resistance. Gasoil cracks may dictate crude direction as distillate stocks hover near seasonal lows, with refinery maintenance peaks limiting product buffer capacity. Position squaring ahead of US payrolls data adds another volatility layer, particularly if dollar strength reasserts pressure on commodity benchmarks.

Disclaimer
The content on MarketsFN.com is provided for educational and informational purposes only. It does not constitute financial advice, investment recommendations, or trading guidance. All investments involve risks, and past performance does not guarantee future results. You are solely responsible for your investment decisions and should conduct independent research and consult a qualified financial advisor before acting. MarketsFN.com and its authors are not liable for any losses or damages arising from your use of this information.
Related Articles
- US Session Crude Oil Report — 14 Oct 2026 — WTI crude is trading at $90.86 in the NYMEX session, down 0.27% on the day as it struggles to rebound from oversold…
- Chile Earthquake Disrupts Copper Supply — Earthquake in Chilean Copper Belt: A Potential Supply Shock In the early hours of October 14, 2026, a magnitude 5.1…
- European Session Crude Oil Report — 14 Oct 2026 — Crude oil markets remain under pressure in the European session as WTI hovers near $90.86 while Brent struggles to hold…
- US Session Crude Oil Report — 13 Oct 2026 — WTI crude is trading at $90.86 in early New York session action, holding near its pivot point at $89.46 as the market…
- European Session Crude Oil Report — 13 Oct 2026 — Crude oil markets trade mixed in the European session as Brent holds above $103 while WTI struggles near $90.80, with…