Nasdaq 100 52-Week Highs & Lows Radar: Electronic Arts, (EA), Idexx Laboratories, (IDXX) and more
MarketsFN Team

Nasdaq 100 52-Week Highs & Lows Radar: Electronic Arts, (EA), Idexx Laboratories, (IDXX) and more
Screening all 101 Nasdaq 100 constituents for stocks nearest to their 52-week high and their 52-week low. Data as of September 11, 2026. % Realized = 52-week total return.
Legend: RSI > 70 = overbought · RSI < 30 = oversold · Green % Realized = positive 52W return · Red = negative.
📈 Nearest to 52-Week High
Sectors represented: Communication Services (1), Technology (1), Healthcare (1), Consumer Defensive (1), Energy (1)
| Ticker | Company | Sector | Price Last | % Realized | 52-Week High Date | RSI | % above MA200 | Trend |
|---|---|---|---|---|---|---|---|---|
| EA | Electronic Arts, Inc | Communication Services | $209.70 | +0.38% | 2026-08-04 | — | — | — |
| AAPL | Apple Inc | Technology | $332.48 | +44.54% | 2026-07-28 | 62.9 | +16.7% | Above MA20, MA50, MA200 |
| BIIB | Biogen Inc | Healthcare | $216.65 | +45.56% | 2026-09-03 | 52.7 | +12.9% | Above MA50, MA200 · Below MA20 |
| MDLZ | Mondelez International Inc | Consumer Defensive | $62.34 | +0.47% | 2026-07-29 | 50.3 | +5.3% | Above MA50, MA200 · Below MA20 |
| FANG | Diamondback Energy Inc | Energy | $203.90 | +47.31% | 2026-05-04 | 54.2 | +12.1% | Above MA20, MA50, MA200 |
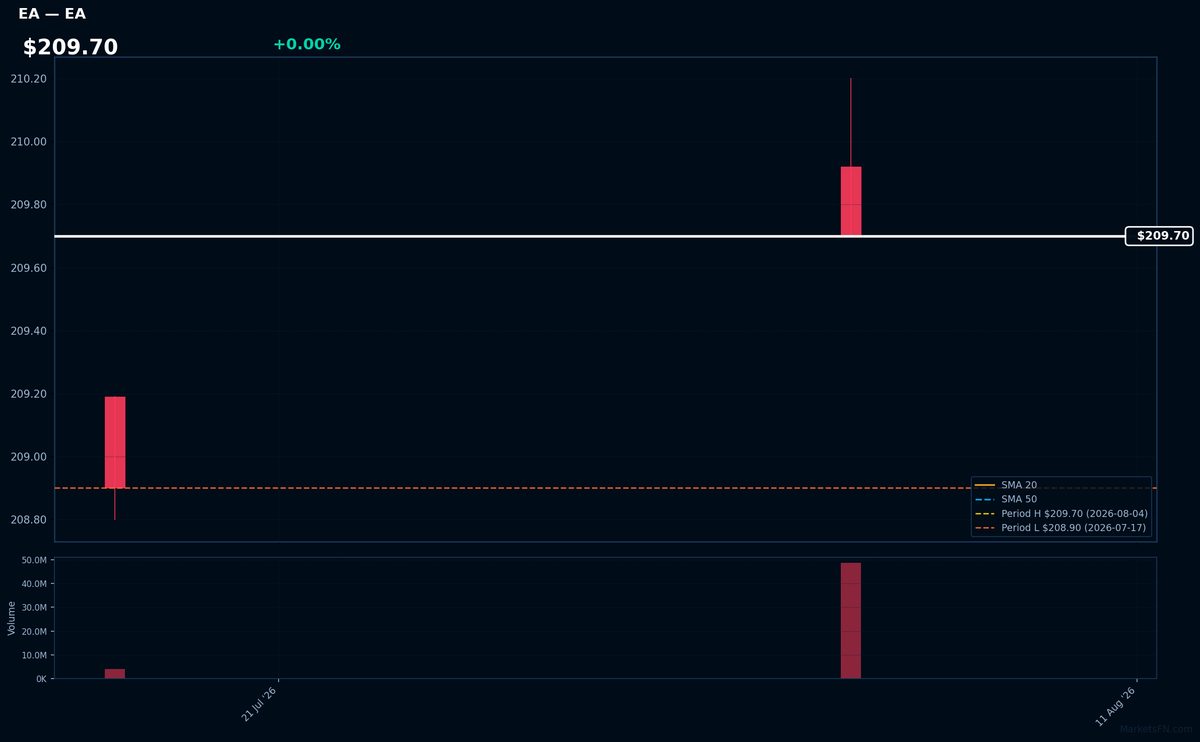
EA | Electronic Arts, Inc | Communication Services | Price Last: $209.70 | % Realized: +0.38% | RSI: — | % above MA200: — | Trend: —
Electronic Arts, Inc (EA) is a video game company that develops and publishes games such as FIFA, Madden NFL, and The Sims. Investors should care because EA's success in these franchises drives revenue and profitability.
The stock is near its 52-Week high, up 0.4% over the period, but MA alignment and RSI(14) data are unavailable for technical assessment.
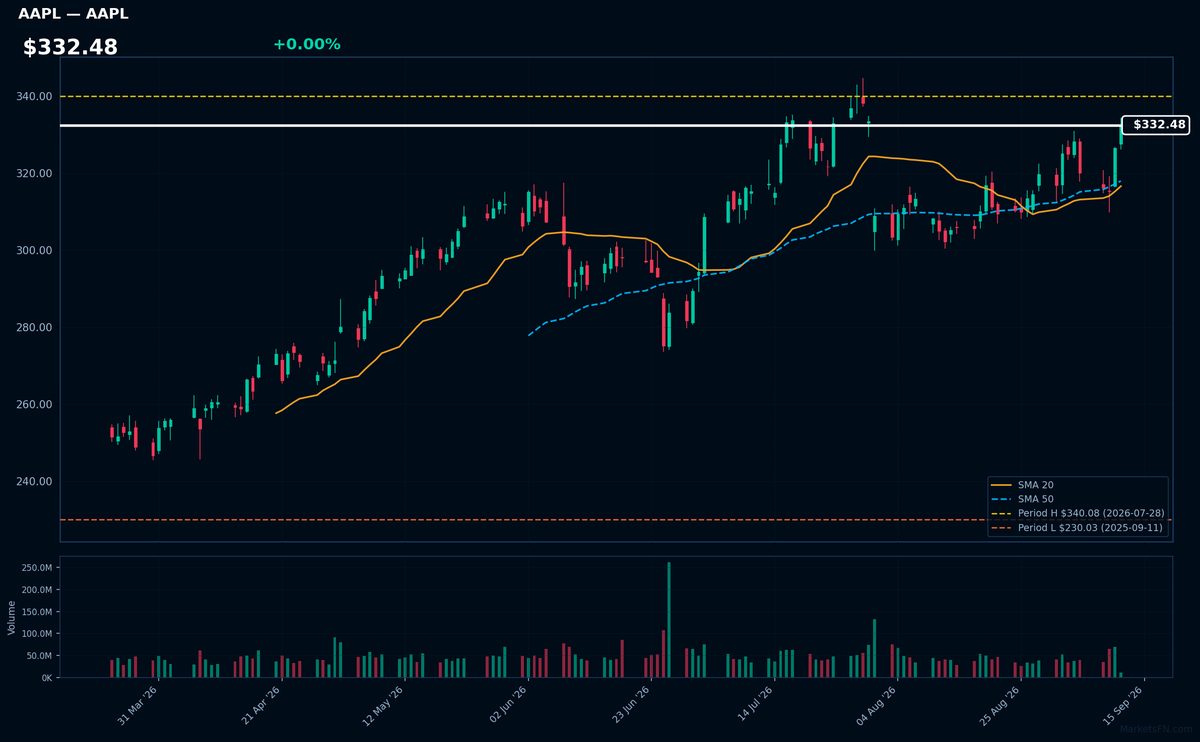
AAPL | Apple Inc | Technology | Price Last: $332.48 | % Realized: +44.54% | RSI: 62.9 | % above MA200: +16.7% | Trend: Above MA20, MA50, MA200
Apple Inc designs, manufactures, and markets consumer electronics, software, and services, generating revenue primarily from iPhone sales and services like Apple Music and iCloud. Investors care about its innovation pipeline and ecosystem lock-in.
AAPL's RSI(14) is 62.9, indicating moderate momentum. The stock is above MA20, MA50, and MA200, with a 2.2% discount to its 52-Week high, suggesting a potential breakout. The 44.5% 52-Week return reinforces the momentum narrative.
Related headlines
- Kalshi Eyes 24/7 Leveraged Bets on TSLA, NVDA and AAPL With New Perpetual Futures Push: Report
- Apple cracks mmWave with C2, weakening Qualcomm's last big iPhone modem edge
- Crypto Billionaire Finds iPhone Duo Pretty 'Good' For Gawking at Financial Charts Crypto Prediction Market is Already Betting on The Next Big Apple Gadget
- Apple's new chip packaging boosts A20 Pro AI power, pushing MediaTek, Qualcomm to follow suit
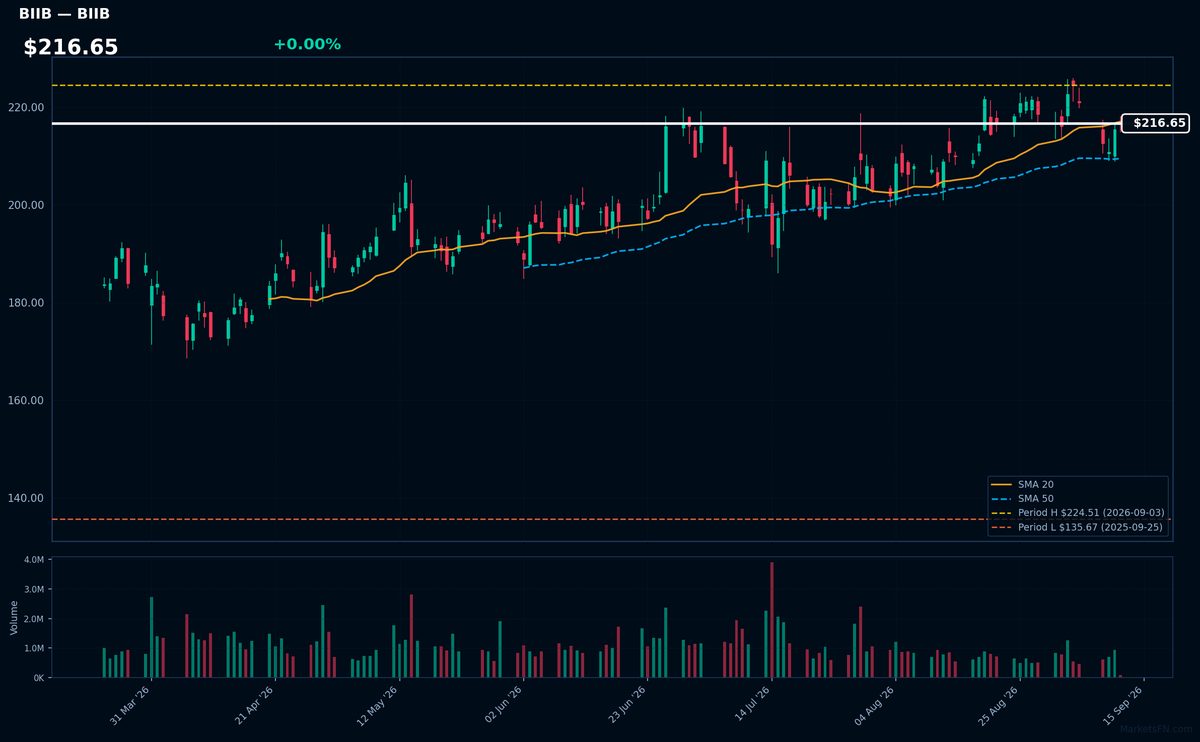
BIIB | Biogen Inc | Healthcare | Price Last: $216.65 | % Realized: +45.56% | RSI: 52.7 | % above MA200: +12.9% | Trend: Above MA50, MA200 · Below MA20
Biogen Inc is a biotechnology company that develops treatments for neurological diseases such as multiple sclerosis and Alzheimer's. Investors should care because its innovative therapies have significant market potential and revenue growth prospects.
Biogen's technicals show mixed signals: RSI(14) is 52.7, indicating neutral momentum. The stock is above MA50/MA200 but below MA20, and is 3.5% below its 52-Week high, suggesting a potential breakout.
Related headlines
- Stoke Therapeutics and Biogen Present Long-Term Clinical Data that Support the Disease-Modifying Potential of Zorevunersen, an Investigational Medicine for the Treatment of Dravet Syndrome, at the 16th European Epilepsy Congress (EEC)
- Stoke Therapeutics and Biogen to present four-year zorevunersen data at epilepsy congress
- Stoke Therapeutics and Biogen Announce Presentations of Clinical Data from Studies of Zorevunersen, an Investigational Medicine for the Treatment of Dravet Syndrome, at the 16th European Epilepsy Congress (EEC)
- Wolfe Research upgrades Biogen, AbbVie on pipeline strength and valuation
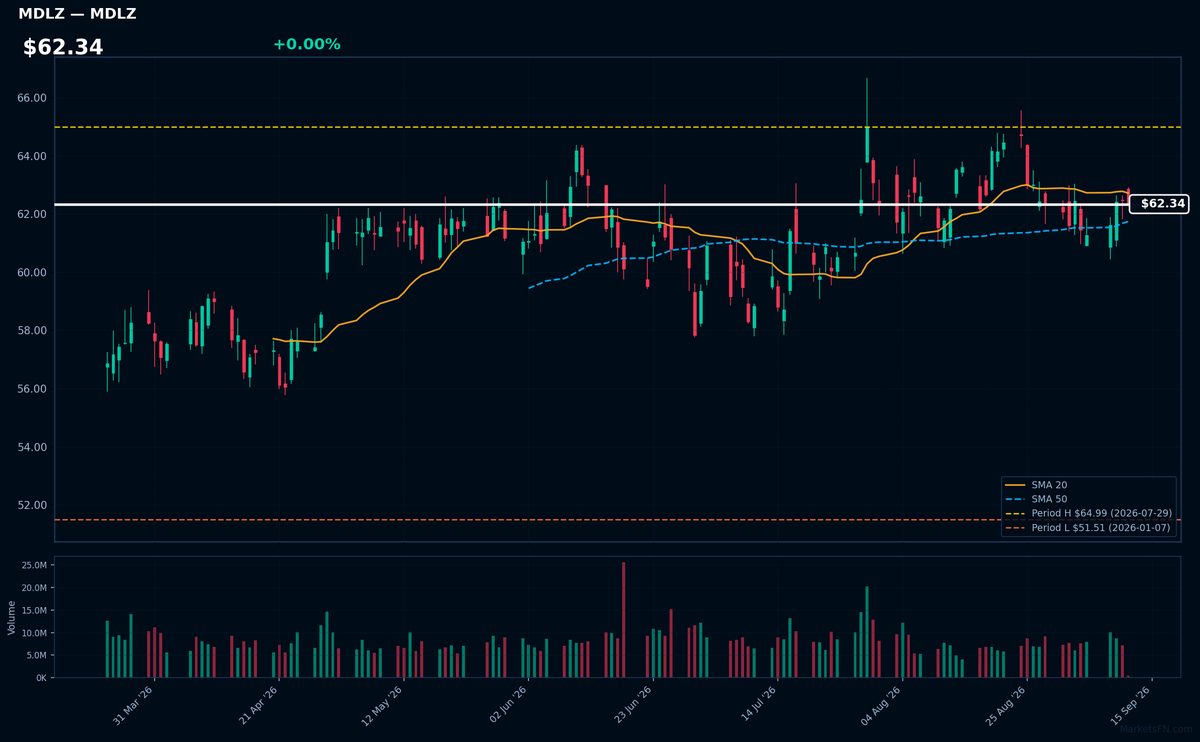
MDLZ | Mondelez International Inc | Consumer Defensive | Price Last: $62.34 | % Realized: +0.47% | RSI: 50.3 | % above MA200: +5.3% | Trend: Above MA50, MA200 · Below MA20
Mondelez International Inc is a global snacking leader with brands like Oreo and Chips Ahoy. Investors should care about its ability to drive growth through premiumization and geographic expansion, potentially impacting revenue and profitability.
The stock's RSI is 50.3, indicating neutral momentum. With the price above MA50/MA200 but below MA20, it shows mixed signals. Being 4.1% below its 52-Week high, it is near a potential breakout level.
Related headlines
- How Mondelez wants to shake up snacking with cookies
- Müller teams up on yogurt NPD with Mondelez, Pladis
- Mondelez International Continues to Expand Sports Footprint with Sponsorships Across Five Powerhouse College Athletics Programs
- Mondelez International to Participate in Barclays Global Consumer Staples Conference on September 9, 2026
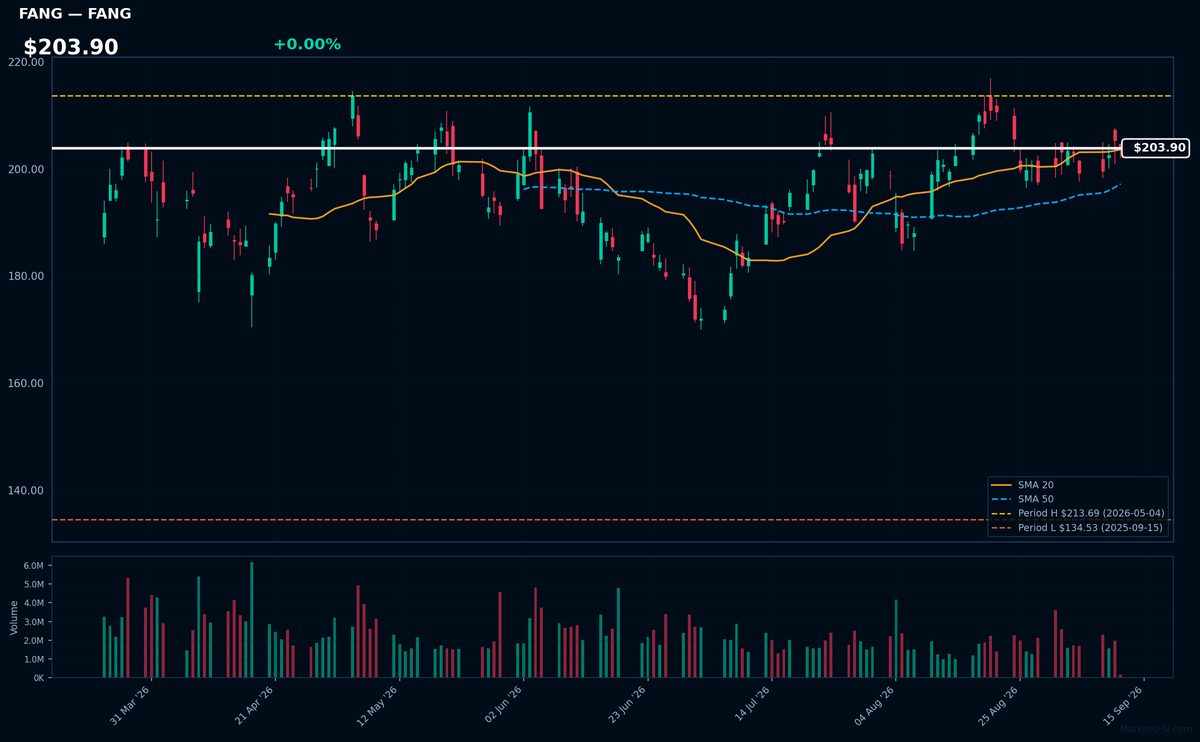
FANG | Diamondback Energy Inc | Energy | Price Last: $203.90 | % Realized: +47.31% | RSI: 54.2 | % above MA200: +12.1% | Trend: Above MA20, MA50, MA200
Diamondback Energy Inc is an oil and gas exploration and production company. Investors should care because its performance is tied to energy prices and production levels, directly impacting revenue and profitability.
Diamondback Energy Inc shows a sustained uptrend with price > MA20 > MA50 > MA200, RSI(14) at 54.2, and is 4.6% below its 52-Week high, indicating momentum with a potential breakout.
Related headlines
📉 Nearest to 52-Week Low
Sectors represented: Healthcare (1), Communication Services (1), Consumer Cyclical (1), Consumer Defensive (1), Utilities (1)
| Ticker | Company | Sector | Price Last | % Realized | 52-Week Low Date | RSI | % above MA200 | Trend |
|---|---|---|---|---|---|---|---|---|
| IDXX | Idexx Laboratories, Inc | Healthcare | $500.83 | -22.37% | 2026-09-11 | 30.5 | -17.0% | Below MA20, MA50, MA200 |
| EA | Electronic Arts, Inc | Communication Services | $209.70 | +0.38% | 2026-07-17 | — | — | — |
| LULU | Lululemon Athletica inc | Consumer Cyclical | $97.67 | -41.08% | 2026-09-10 | 32.1 | -35.5% | Below MA20, MA50, MA200 |
| PEP | PepsiCo Inc | Consumer Defensive | $136.59 | -5.30% | 2026-07-23 | 40.1 | -8.1% | Below MA20, MA50, MA200 |
| EXC | Exelon Corp | Utilities | $43.41 | -0.21% | 2025-09-16 | 37.9 | -5.4% | Below MA20, MA50, MA200 |
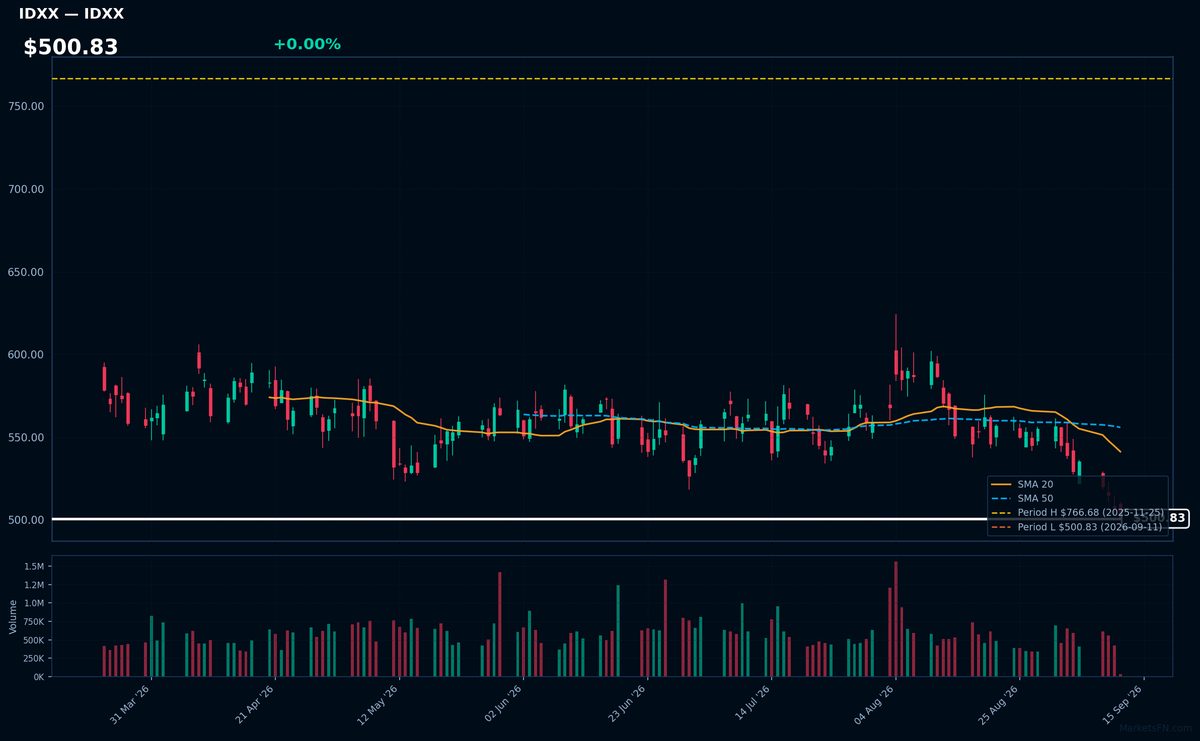
IDXX | Idexx Laboratories, Inc | Healthcare | Price Last: $500.83 | % Realized: -22.37% | RSI: 30.5 | % above MA200: -17.0% | Trend: Below MA20, MA50, MA200
Idexx Laboratories, Inc is a veterinary diagnostics company providing testing solutions for companion animals and livestock. Investors should care due to its dominant market position and growth potential driven by increasing pet ownership and advancements in animal healthcare.
IDXX is in a sustained downtrend with price ($500.83) below MA20, MA50, and MA200. The RSI(14) is 30.5, near oversold territory, and the stock is at its 52-Week low, indicating potential support testing, a warning sign for further downside risk.
Related headlines
- IDEXX Laboratories to Participate in Morgan Stanley 24th Annual Global Healthcare Conference
- IDEXX Expands Catalyst Platform into Cardiac Disease with First and Only Dual-Species Point-of-Care NT-proBNP Test
- IDEXX Laboratories, Inc. Q2 2026 Earnings Call Summary
- IDEXX Laboratories Inc (IDXX) (Q2 2026) Earnings Call Highlights: Strong Revenue Growth and ...
EA | Electronic Arts, Inc | Communication Services | Price Last: $209.70 | % Realized: +0.38% | RSI: — | % above MA200: — | Trend: —
Electronic Arts, Inc (EA) is a video game company that develops and publishes games such as FIFA, Madden NFL, and The Sims. Investors should care because EA's success in these franchises drives revenue and profitability.
The stock is near its 52-Week high, up 0.4% over the period, but MA alignment and RSI(14) data are unavailable for technical assessment.
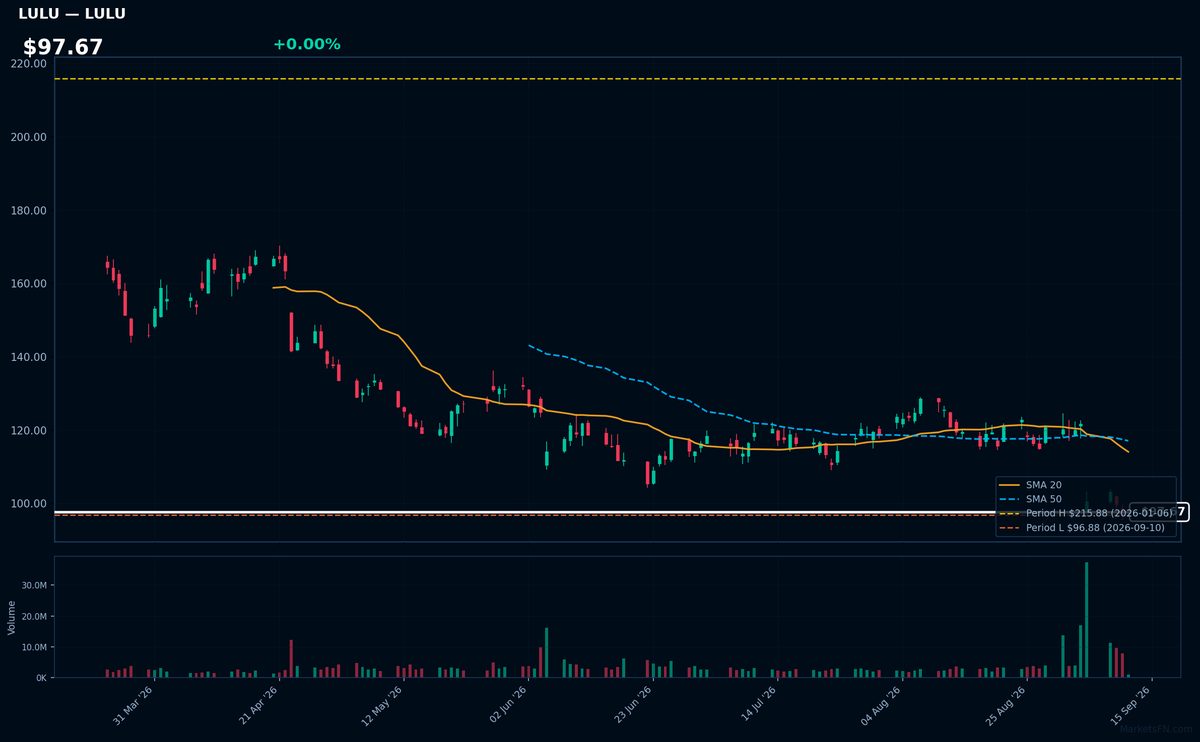
LULU | Lululemon Athletica inc | Consumer Cyclical | Price Last: $97.67 | % Realized: -41.08% | RSI: 32.1 | % above MA200: -35.5% | Trend: Below MA20, MA50, MA200
Lululemon Athletica inc designs and sells high-end athletic wear, particularly yoga apparel. Investors care due to its strong brand loyalty and premium pricing power, which drive revenue growth and profitability in the competitive athleisure market.
Lululemon's technicals indicate a sustained downtrend with price ($97.67) below MA20, MA50, and MA200. The RSI(14) is 32.1, near oversold territory, and the stock is 0.8% above its 52-Week low, testing major support after a -41.1% 52-Week return.
Related headlines
- Controversial Lululemon founder Chip Wilson didn't have a prenup that could cost him half of a $6.1 billion fortune
- Shifting Consumer Preferences Continue to Impact NKE and LULU
- LULU, LOW Stocks Hit Multi-Year Lows Heres What Wall Street Is Saying
- Why Nike and Lululemon are struggling: 'A lot of surface area to defend'
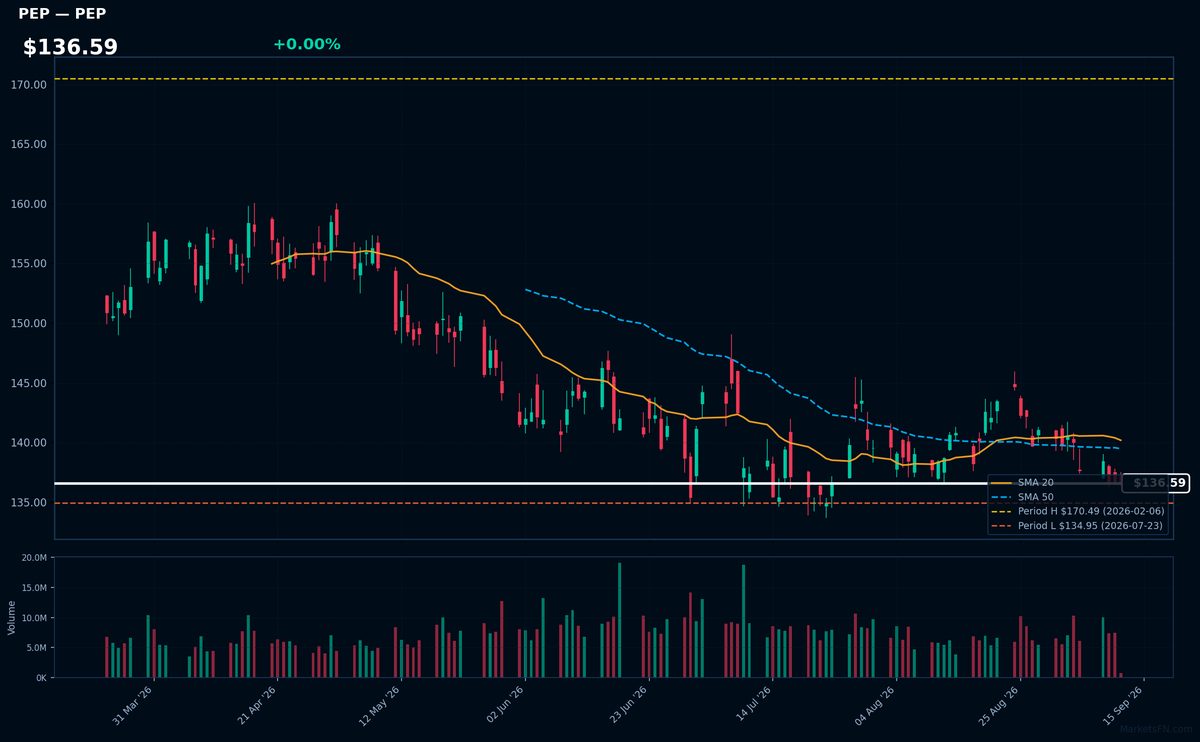
PEP | PepsiCo Inc | Consumer Defensive | Price Last: $136.59 | % Realized: -5.30% | RSI: 40.1 | % above MA200: -8.1% | Trend: Below MA20, MA50, MA200
PepsiCo Inc is a diversified food and beverage company with brands like Pepsi, Lay's, and Gatorade, generating revenue through beverage sales, snack foods, and other categories. Investors care about its stable cash flows and dividend yield.
PepsiCo's technical situation is bearish, with RSI(14) at 40.1, below MA20/MA50/MA200, and only 1.2% above its 52-Week low, indicating a testing of major support and potential further downside, as it has returned -5.3% over the 52-Week period.
Related headlines
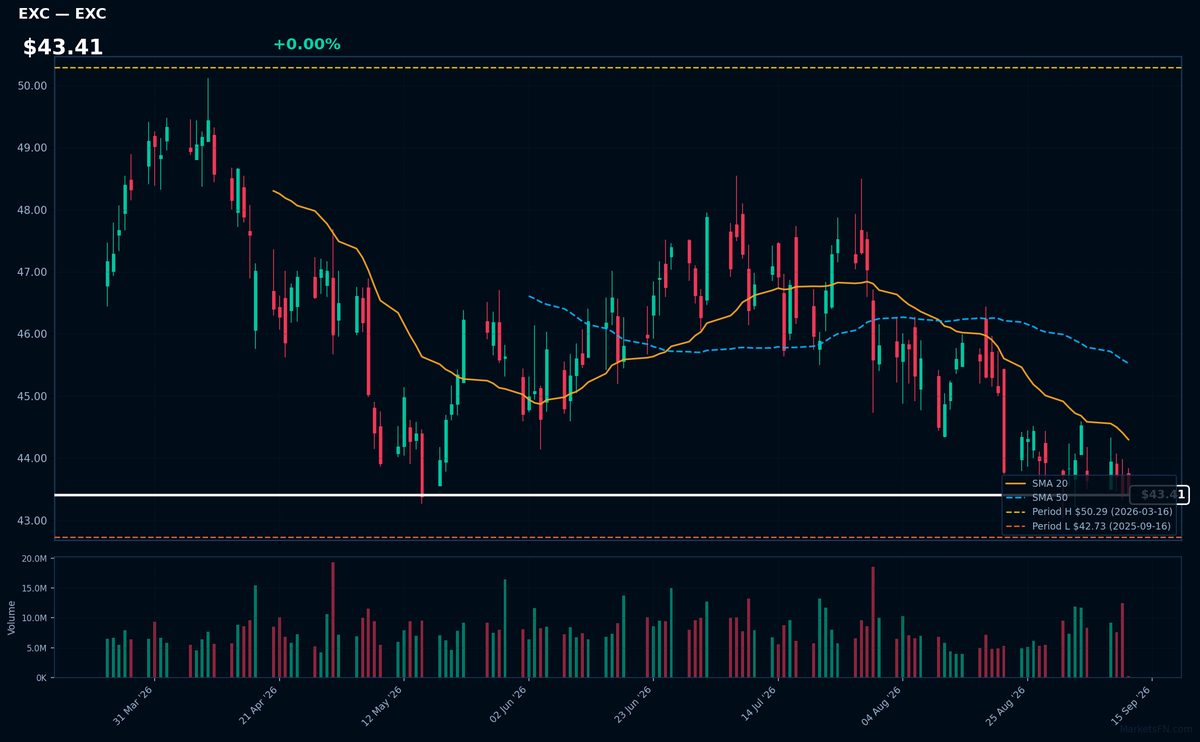
EXC | Exelon Corp | Utilities | Price Last: $43.41 | % Realized: -0.21% | RSI: 37.9 | % above MA200: -5.4% | Trend: Below MA20, MA50, MA200
Exelon Corp is a utility company that generates and distributes electricity, operating nuclear, natural gas, and renewable energy facilities. Investors should care about its stable cash flows and dividend yield, given its role in meeting US energy demands.
Exelon Corp's technical situation is bearish, with an RSI(14) of 37.9 indicating oversold conditions, and a sustained downtrend as price ($43.41) remains below MA20, MA50, and MA200. The stock is near its 52-Week low, 1.6% above it, signaling potential support testing.
Related headlines
- Exelon Announces Key Leadership Position Changes
- Exelon Secures More Than $1 Billion in Customer Protections Through Pioneering Transmission Security Agreements
- Exelon high probability data center load falls 40%
- Exelon Corp (EXC) (Q2 2026) Earnings Call Highlights: Navigating Regulatory Hurdles and Data ...
Market Commentary
The Nasdaq 100 stocks near 52-week extremes signal a potential shift in market sentiment. Stocks like EA are near both 52-week highs and lows, indicating a narrow trading range. AAPL and BIIB are within 3.5% of their 52-week highs, while IDXX and LULU are near their 52-week lows.
The technology sector is driving these price levels, with stocks like AAPL and EA reflecting investor confidence. Macro themes, such as consumer spending (MDLZ, PEP) and energy trends (FANG), are also influencing these stocks. The proximity to 52-week extremes may indicate a buildup for a potential breakout or breakdown.
Key levels to watch include the 52-week highs for AAPL (-2.2% away) and BIIB (-3.5% away), and the 52-week lows for IDXX and LULU (+0.0% and +0.8% above, respectively). Potential catalysts for a breakout or breakdown include earnings reports and macroeconomic data releases. Monitoring these levels and catalysts will be crucial in determining the direction of these stocks.
Methodology: All 101 Nasdaq 100 constituents screened. 52-week high = highest daily close over the past 252 trading days (approx. 1 year). 52-week low = lowest daily close over the same period. Distance = (current price / extreme − 1) × 100. Technical indicators computed on up to 1 year of daily OHLCV data.
Disclaimer: For informational purposes only. Not investment advice. Past performance is not indicative of future results.