Nasdaq 100 2026 YTD Highs & Lows Radar: Electronic Arts, (EA), Lululemon Athletica inc (LULU) and more
MarketsFN Team

Nasdaq 100 2026 YTD Highs & Lows Radar: Electronic Arts, (EA), Lululemon Athletica inc (LULU) and more
Screening all 101 Nasdaq 100 constituents for stocks nearest to their 2026 year-to-date high and their 2026 YTD low. Data as of September 08, 2026. % Realized = total return since Jan 1 2026.
Legend: RSI > 70 = overbought · RSI < 30 = oversold · Green % Realized = positive YTD return · Red = negative.
📈 Nearest to 2026 High
Sectors represented: Healthcare (3), Communication Services (1), Technology (1)
| Ticker | Company | Sector | Price Last | % Realized | 2026 YTD High Date | RSI | % above MA200 | Trend |
|---|---|---|---|---|---|---|---|---|
| EA | Electronic Arts, Inc | Communication Services | $209.70 | +0.38% | 2026-08-04 | — | — | — |
| CDW | CDW Corp | Technology | $152.38 | +14.43% | 2026-08-04 | 55.1 | +15.6% | Above MA20, MA50, MA200 |
| AMGN | AMGEN Inc | Healthcare | $437.23 | +33.45% | 2026-09-03 | 41.9 | +21.9% | Above MA20, MA50, MA200 |
| BIIB | Biogen Inc | Healthcare | $220.83 | +24.19% | 2026-09-03 | 52.8 | +15.4% | Above MA20, MA50, MA200 |
| VRTX | Vertex Pharmaceuticals, Inc | Healthcare | $546.12 | +20.79% | 2026-09-03 | 51.4 | +17.0% | Above MA20, MA50, MA200 |
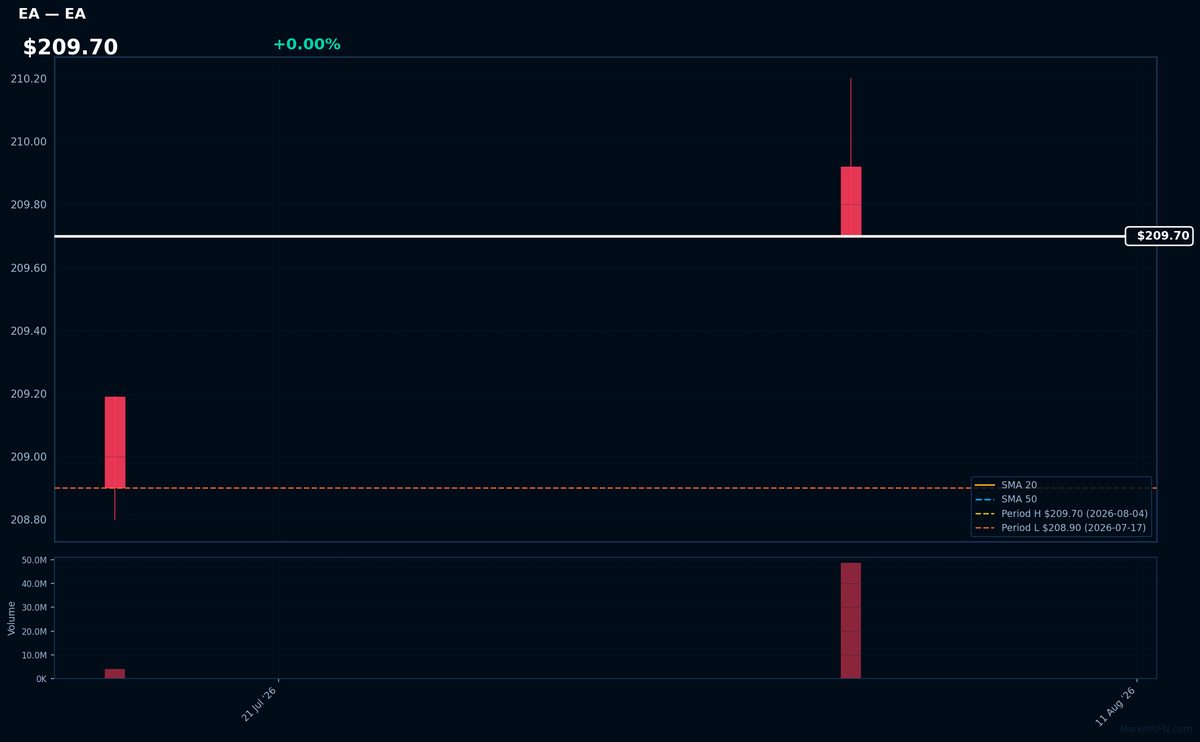
EA | Electronic Arts, Inc | Communication Services | Price Last: $209.70 | % Realized: +0.38% | RSI: — | % above MA200: — | Trend: —
Electronic Arts, Inc (EA) is a leading interactive entertainment software company. Investors should care because EA is a major player in the gaming industry, with popular franchises like FIFA and Madden NFL, generating significant revenue.
The stock is near its 2026 YTD high, up 0.4% YTD. With RSI(14) being N/A and MA data incomplete, technical indicators are inconclusive. The proximity to the YTD high may indicate a potential breakout.
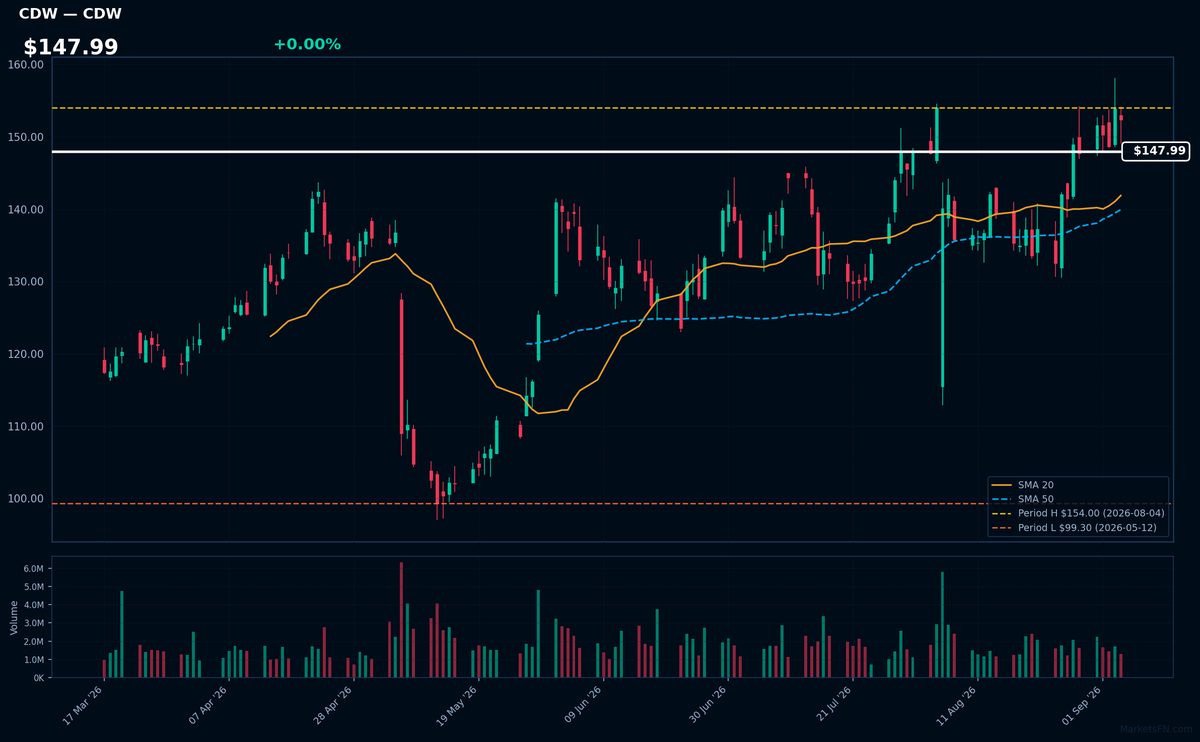
CDW | CDW Corp | Technology | Price Last: $152.38 | % Realized: +14.43% | RSI: 55.1 | % above MA200: +15.6% | Trend: Above MA20, MA50, MA200
CDW Corp is a technology solutions provider offering a range of products and services to businesses, governments, and educational institutions. Investors should care because its diversified portfolio and strong relationships with major technology vendors position it for growth in the expanding IT infrastructure market.
CDW Corp's technical situation indicates sustained uptrend with price > MA20 > MA50 > MA200. RSI(14) is 55.1, suggesting moderate momentum. The stock is 1.1% below its 2026 YTD high, nearing a potential breakout level, with 14.4% return over the 2026 YTD period.
Related headlines
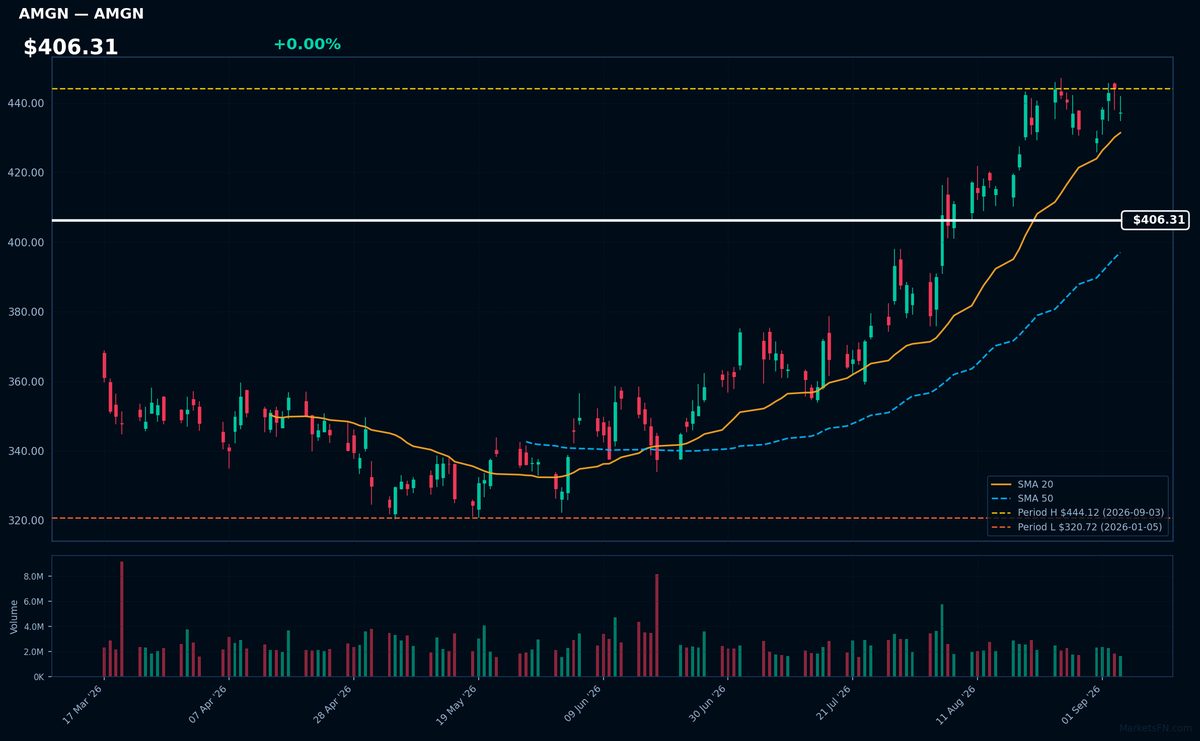
AMGN | AMGEN Inc | Healthcare | Price Last: $437.23 | % Realized: +33.45% | RSI: 41.9 | % above MA200: +21.9% | Trend: Above MA20, MA50, MA200
AMGEN Inc is a biotechnology company that develops and markets human therapeutics, focusing on innovative treatments for serious illnesses such as cancer, cardiovascular disease, and bone health conditions, making it an attractive investment for those seeking exposure to the biotech sector.
AMGN's technicals show mixed signals: RSI(14) at 41.9 indicates neutral momentum, with price above MA50/MA200 but below MA20; it's 1.6% below its 2026 YTD high, suggesting a potential breakout level, and has delivered 33.4% returns over the 2026 YTD period.
Related headlines
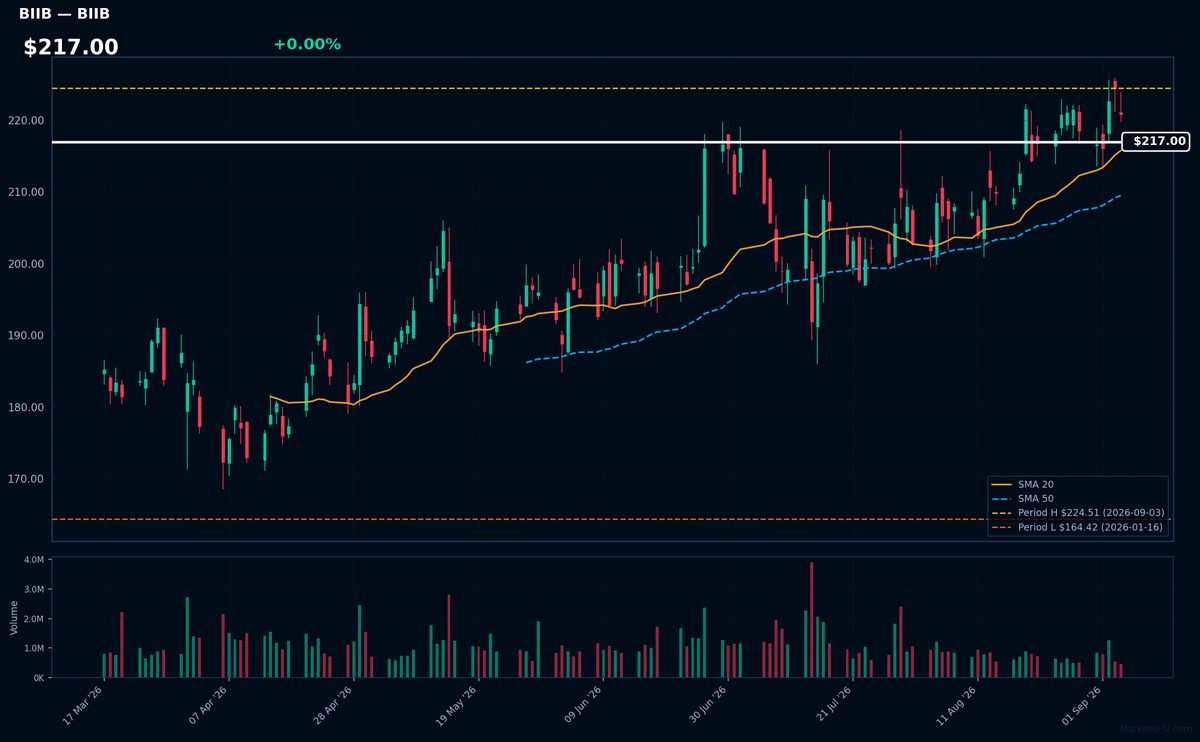
BIIB | Biogen Inc | Healthcare | Price Last: $220.83 | % Realized: +24.19% | RSI: 52.8 | % above MA200: +15.4% | Trend: Above MA20, MA50, MA200
Biogen Inc (BIIB) develops and markets therapies for neurological disorders, such as multiple sclerosis and Alzheimer's disease. Investors should care about its pipeline advancements and revenue growth from existing treatments.
Biogen Inc's current technical situation indicates sustained uptrend with price > MA20 > MA50 > MA200, RSI(14) at 52.8, and is 1.6% below its 2026 YTD high, suggesting potential breakout momentum.
Related headlines
- Stoke Therapeutics and Biogen Present Long-Term Clinical Data that Support the Disease-Modifying Potential of Zorevunersen, an Investigational Medicine for the Treatment of Dravet Syndrome, at the 16th European Epilepsy Congress (EEC)
- Stoke Therapeutics and Biogen to present four-year zorevunersen data at epilepsy congress
- Stoke Therapeutics and Biogen Announce Presentations of Clinical Data from Studies of Zorevunersen, an Investigational Medicine for the Treatment of Dravet Syndrome, at the 16th European Epilepsy Congress (EEC)
- Wolfe Research upgrades Biogen, AbbVie on pipeline strength and valuation
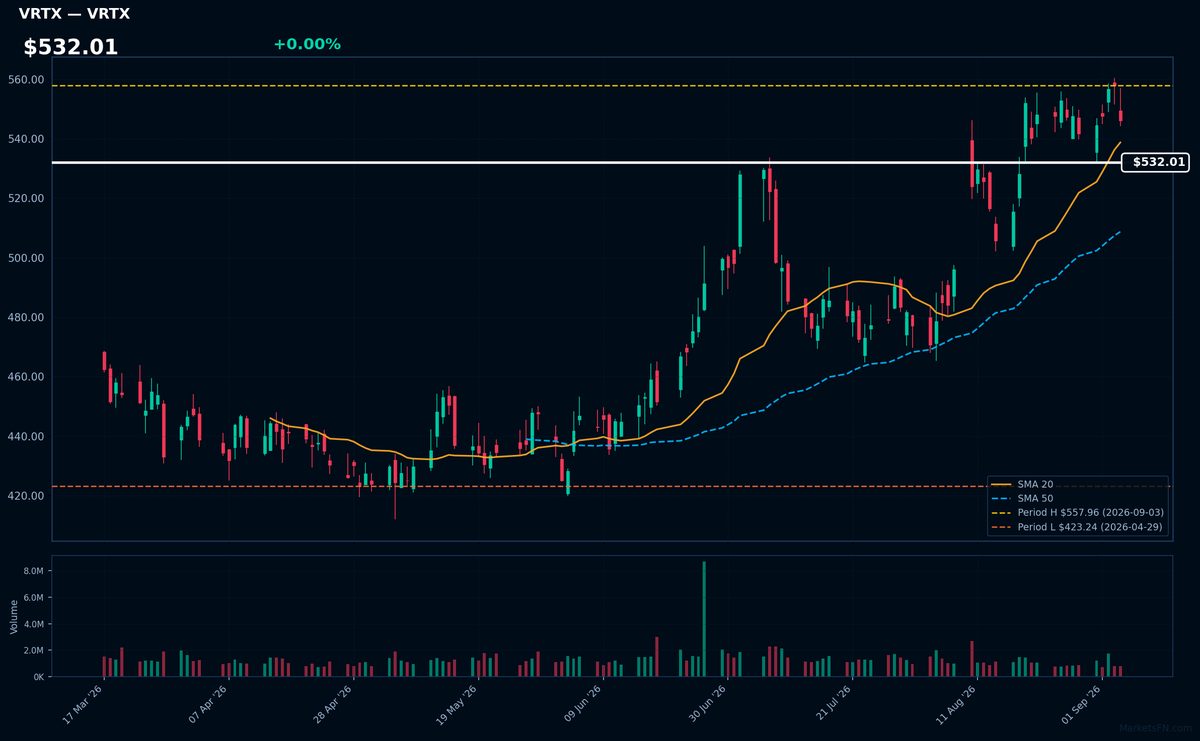
VRTX | Vertex Pharmaceuticals, Inc | Healthcare | Price Last: $546.12 | % Realized: +20.79% | RSI: 51.4 | % above MA200: +17.0% | Trend: Above MA20, MA50, MA200
Vertex Pharmaceuticals, Inc is a biotechnology company that develops and commercializes therapies for cystic fibrosis and other serious diseases. Investors should care due to its strong pipeline and existing treatments, such as Trikafta, which drives revenue growth.
The stock's RSI is 51.4, indicating neutral momentum. With the price above MA50/MA200 but below MA20, it shows mixed signals. Being 2.1% below its 2026 YTD high, it is near a potential breakout level, having gained 20.8% YTD.
Related headlines
- Vertex Completes $10 Billion Crinetics Acquisition, Adding Rare Endocrine Growth Platform
- Vertex Completes Acquisition of Crinetics Pharmaceuticals and Announces Expansion of Executive Leadership Team
- Vertex to Participate in Upcoming September Investor Conferences
- Vertex Stock Jumps 5.9% as Rival Cystic Fibrosis Drug Fails
📉 Nearest to 2026 Low
Sectors represented: Consumer Cyclical (1), Communication Services (1), Healthcare (1), Utilities (1), Consumer Defensive (1)
| Ticker | Company | Sector | Price Last | % Realized | 2026 YTD Low Date | RSI | % above MA200 | Trend |
|---|---|---|---|---|---|---|---|---|
| LULU | Lululemon Athletica inc | Consumer Cyclical | $100.61 | -52.27% | 2026-09-04 | 33.4 | -34.0% | Below MA20, MA50, MA200 |
| EA | Electronic Arts, Inc | Communication Services | $209.70 | +0.38% | 2026-07-17 | — | — | — |
| IDXX | Idexx Laboratories, Inc | Healthcare | $535.38 | -20.09% | 2026-06-30 | 36.3 | -11.7% | Below MA20, MA50, MA200 |
| EXC | Exelon Corp | Utilities | $43.64 | -0.64% | 2026-01-12 | 40.4 | -5.0% | Below MA20, MA50, MA200 |
| PEP | PepsiCo Inc | Consumer Defensive | $137.63 | -3.23% | 2026-07-23 | 43.1 | -7.5% | Below MA20, MA50, MA200 |
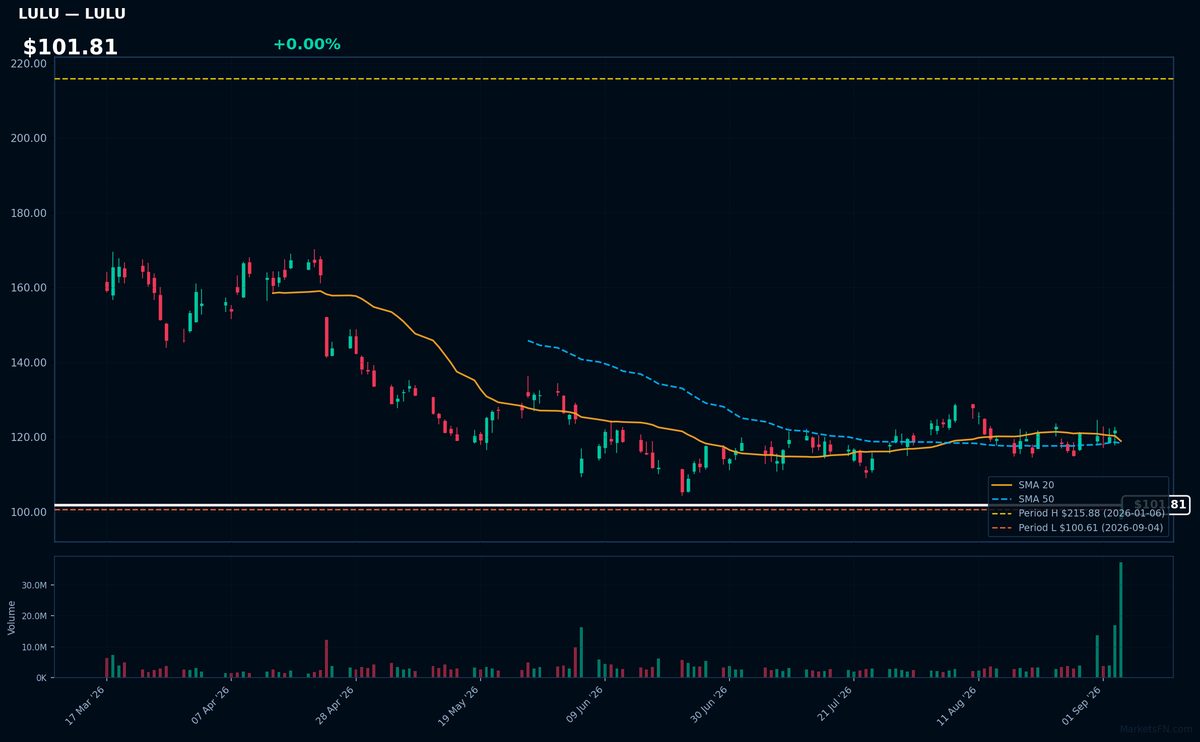
LULU | Lululemon Athletica inc | Consumer Cyclical | Price Last: $100.61 | % Realized: -52.27% | RSI: 33.4 | % above MA200: -34.0% | Trend: Below MA20, MA50, MA200
Lululemon Athletica inc designs and sells high-end athletic wear, particularly yoga apparel. Investors care about its brand strength, product innovation, and ability to maintain premium pricing, which drives revenue growth and profitability.
Lululemon's technical situation is bearish, with an RSI(14) of 33.4 indicating oversold conditions and a sustained downtrend as price ($101.81) remains below MA20, MA50, and MA200, with the stock testing major support at its 2026 YTD low.
Related headlines
EA | Electronic Arts, Inc | Communication Services | Price Last: $209.70 | % Realized: +0.38% | RSI: — | % above MA200: — | Trend: —
Electronic Arts, Inc (EA) is a leading interactive entertainment software company. Investors should care because EA is a major player in the gaming industry, with popular franchises like FIFA and Madden NFL, generating significant revenue.
The stock is near its 2026 YTD high, up 0.4% YTD. With RSI(14) being N/A and MA data incomplete, technical indicators are inconclusive. The proximity to the YTD high may indicate a potential breakout.
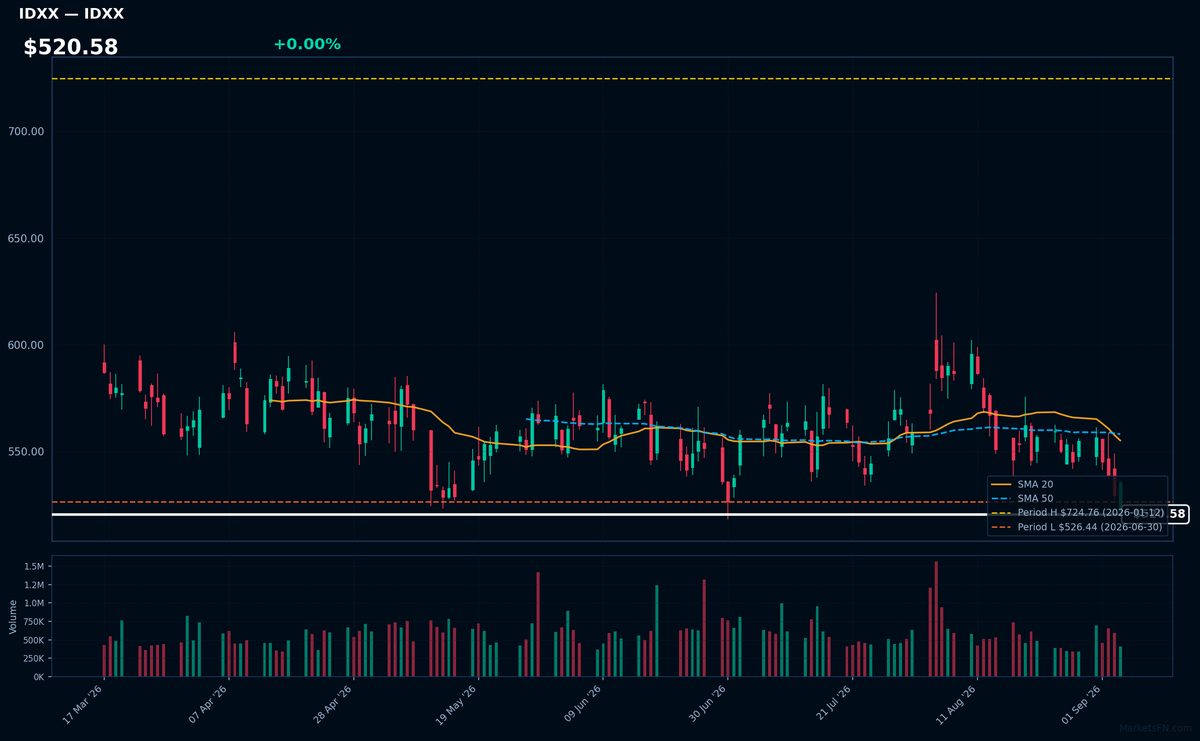
IDXX | Idexx Laboratories, Inc | Healthcare | Price Last: $535.38 | % Realized: -20.09% | RSI: 36.3 | % above MA200: -11.7% | Trend: Below MA20, MA50, MA200
Idexx Laboratories, Inc is a veterinary diagnostics company providing testing solutions and software. Investors should care due to its dominant position in the $7 billion global veterinary diagnostics market, driven by pet ownership trends and increasing demand for animal health services.
IDXX is in a sustained downtrend with price ($520.58) below MA20, MA50, and MA200. RSI(14) is 36.3, near oversold territory. The stock is 1.7% above its 2026 YTD low, testing major support after a -20.1% 2026 YTD return, indicating potential further downside risk.
Related headlines
- IDEXX Laboratories to Participate in Morgan Stanley 24th Annual Global Healthcare Conference
- IDEXX Expands Catalyst Platform into Cardiac Disease with First and Only Dual-Species Point-of-Care NT-proBNP Test
- IDEXX Laboratories, Inc. Q2 2026 Earnings Call Summary
- IDEXX Laboratories Inc (IDXX) (Q2 2026) Earnings Call Highlights: Strong Revenue Growth and ...
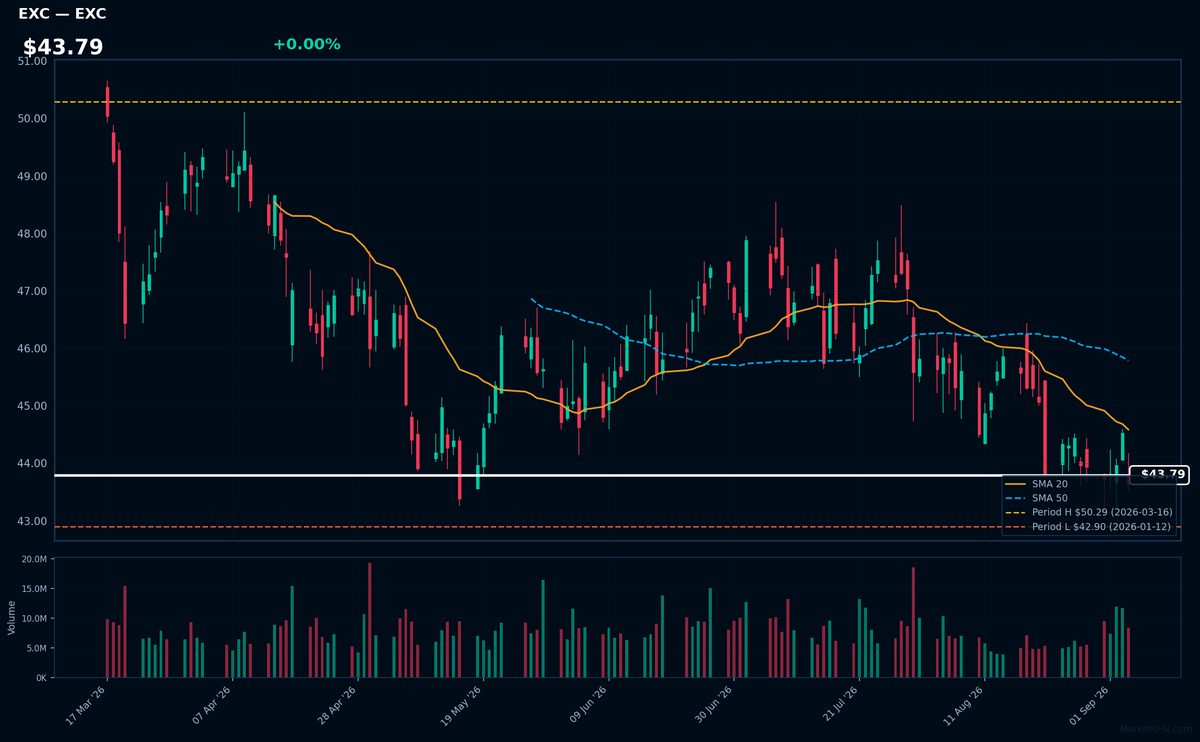
EXC | Exelon Corp | Utilities | Price Last: $43.64 | % Realized: -0.64% | RSI: 40.4 | % above MA200: -5.0% | Trend: Below MA20, MA50, MA200
Exelon Corp (EXC) is a utility company that generates and distributes electricity, primarily through nuclear and natural gas assets, making it a significant player in the energy sector; investors care due to its stable cash flows and dividend yield.
EXC's technicals indicate a sustained downtrend with price ($43.79) below MA20, MA50, and MA200; RSI(14) at 40.4 suggests bearish momentum; the stock is near its 2026 YTD low, at 1.7% above it, signaling a potential support test.
Related headlines
- Exelon Announces Key Leadership Position Changes
- Exelon Secures More Than $1 Billion in Customer Protections Through Pioneering Transmission Security Agreements
- Exelon high probability data center load falls 40%
- Exelon Corp (EXC) (Q2 2026) Earnings Call Highlights: Navigating Regulatory Hurdles and Data ...
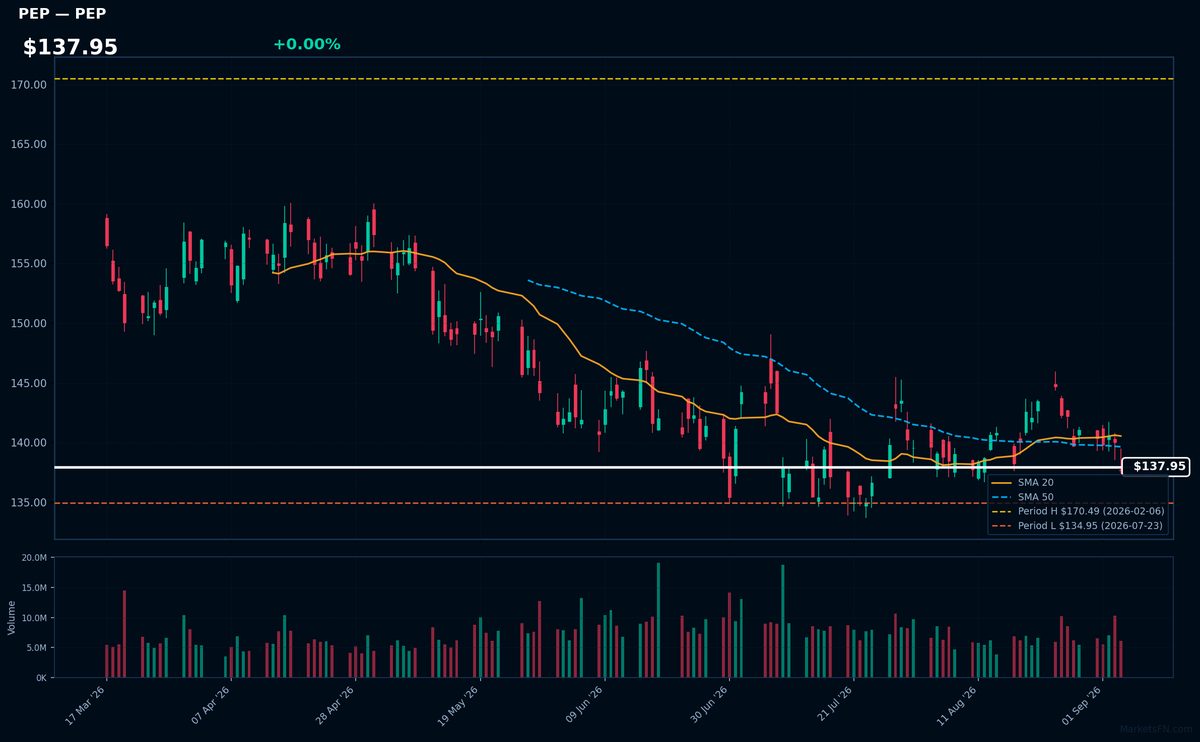
PEP | PepsiCo Inc | Consumer Defensive | Price Last: $137.63 | % Realized: -3.23% | RSI: 43.1 | % above MA200: -7.5% | Trend: Below MA20, MA50, MA200
PepsiCo Inc is a global food and beverage leader with brands like Pepsi, Lay's, and Gatorade, generating revenue through diverse consumer products. Investors care about its stable cash flows and dividend yield amidst changing consumer preferences.
PepsiCo's technicals indicate a warning sign with RSI(14) at 43.1, below MA20/MA50/MA200, and only 2.0% above its 2026 YTD low, suggesting major support testing. The -3.2% 2026 YTD return reinforces bearish sentiment.
Related headlines
Market Commentary
The Nasdaq 100 stocks listed are near their 2026 year-to-date (YTD) extremes, indicating significant price movements. Stocks like EA, CDW, AMGN, BIIB, and VRTX are close to their 2026 highs, while LULU, EA, IDXX, EXC, and PEP are near their 2026 lows. This suggests a notable divergence within the Nasdaq 100.
The technology sector and related stocks are influenced by various macro conditions and themes. The stocks near their 2026 highs, such as AMGN and BIIB, are largely driven by pharmaceutical and biotech trends. In contrast, stocks near their lows, like LULU and PEP, are impacted by consumer and energy sector dynamics. The performance of these stocks reflects broader market sentiments and sector-specific factors.
Investors and traders should monitor the ongoing trends in the pharmaceutical, biotech, and consumer sectors, as well as overall market conditions. Key factors to watch include earnings reports from these companies, regulatory developments, and macroeconomic indicators that could influence the Nasdaq 100's direction. The proximity of these stocks to their YTD extremes may indicate potential breakout or reversal opportunities.
Methodology: All 101 Nasdaq 100 constituents screened. Close prices downloaded from 2026-01-01. Period high = highest close since Jan 1 2026; period low = lowest close since Jan 1 2026. Distance = (current price / period extreme − 1) × 100. Technical indicators computed on up to 1 year of daily OHLCV data.
Disclaimer: For informational purposes only. Not investment advice. Past performance is not indicative of future results.